
Confidential Draft Submitted on February 3, 2017
As filed with the U.S. Securities and Exchange Commission on , 2017
Registration No. 333-
UNITED STATES
SECURITIES AND EXCHANGE COMMISSION
Washington, DC 20549
FORM S-1
REGISTRATION STATEMENT
UNDER
THE SECURITIES ACT OF 1933
Redfin Corporation
(Exact name of Registrant as specified in its charter)
| Delaware | 6531 | 74-3064240 | ||
| (State or other jurisdiction of incorporation or organization) |
(Primary Standard Industrial Classification Code Number) |
(I.R.S. Employer Identification Number) |
1099 Stewart Street, Suite 600
Seattle, WA 98101
(206) 576-8333
(Address, including zip code, and telephone number, including area code, of Registrant’s principal executive offices)
Glenn Kelman
Chief Executive Officer
Redfin Corporation
1099 Stewart Street, Suite 600
Seattle, WA 98101
(206) 576-8333
(Name, address, including zip code, and telephone number, including area code, of agent for service)
Copies to:
| Alan C. Smith James D. Evans Jeffrey R. Vetter Fenwick & West LLP 1191 Second Avenue, Floor 10 Seattle, WA 98101 (206) 389-4510 |
Anthony Kappus General Counsel Redfin Corporation 1099 Stewart Street, Suite 600 Seattle, WA 98101 (206) 576-8333 |
Eric C. Jensen Alan Hambelton Cooley LLP 1700 Seventh Ave, Suite 1900 Seattle, WA 98101 (206) 452-8700 |
Approximate date of commencement of proposed sale to the public: As soon as practicable after the effective date of this Registration Statement.
If any of the securities being registered on this Form are to be offered on a delayed or continuous basis pursuant to Rule 415 under the Securities Act of 1933, as amended, or Securities Act, check the following box. ☐
If this Form is filed to register additional securities for an offering pursuant to Rule 462(b) under the Securities Act, check the following box and list the Securities Act registration statement number of the earlier effective registration statement for the same offering. ☐
If this Form is a post-effective amendment filed pursuant to Rule 462(c) under the Securities Act, check the following box and list the Securities Act registration statement number of the earlier effective registration statement for the same offering. ☐
If this Form is a post-effective amendment filed pursuant to Rule 462(d) under the Securities Act, check the following box and list the Securities Act registration statement number of the earlier effective registration statement for the same offering. ☐
Indicate by check mark whether the registrant is a large accelerated filer, an accelerated filer, a non-accelerated filer, or a smaller reporting company. See definitions of “large accelerated filer,” “accelerated filer,” and “smaller reporting company” in Rule 12b-2 of the Securities Exchange Act of 1934, as amended. (Check one):
| Large accelerated filer | ☐ | Accelerated filer | ☐ | |||
| Non-accelerated filer | ☑ (Do not check if a smaller reporting company) | Smaller reporting company | ☐ |
CALCULATION OF REGISTRATION FEE
|
| ||||
| Title of Each Class of Securities to be Registered |
Proposed Maximum Aggregate |
Amount of Registration Fee | ||
| Common stock, par value $0.001 per share |
$ | $ | ||
|
| ||||
|
| ||||
| (1) | Estimated solely for the purpose of calculating the amount of the registration fee pursuant to Rule 457(o) under the Securities Act. |
| (2) | Includes the aggregate offering price of additional shares that the underwriters have the option to purchase. |
The Registrant hereby amends this Registration Statement on such date or dates as may be necessary to delay its effective date until the Registrant shall file a further amendment that specifically states that this Registration Statement shall thereafter become effective in accordance with Section 8(a) of the Securities Act or until the Registration Statement shall become effective on such date as the Securities and Exchange Commission, acting pursuant to said Section 8(a), may determine.
The information in this preliminary prospectus is not complete and may be changed. We may not sell these securities until the registration statement filed with the Securities and Exchange Commission is effective. This preliminary prospectus is not an offer to sell these securities, nor does it seek an offer to buy these securities in any jurisdiction where the offer or sale is not permitted.
Subject to Completion. Dated , 2017.
Shares
Common Stock
This is an initial public offering of shares of common stock of Redfin Corporation.
Prior to this offering, there has been no public market for our common stock. It is currently estimated that the initial public offering price per share will be between $ and $ . We intend to list our common stock on the under the symbol “RDFN.”
We are an “emerging growth company” as that term is used in the Jumpstart Our Business Startups Act of 2012 and, as such, have elected to comply with certain reduced public company reporting requirements.
See “Risk Factors” beginning on page 15 to read about factors you should consider before buying shares of our common stock.
Neither the Securities and Exchange Commission nor any other regulatory body has approved or disapproved of these securities or passed upon the accuracy or adequacy of this prospectus. Any representation to the contrary is a criminal offense.
| Per Share | Total | |||||||
| Initial public offering price |
$ | $ | ||||||
| Underwriting discount(1) |
$ | $ | ||||||
| Proceeds, before expenses, to us |
$ | $ | ||||||
| (1) | See “Underwriting” for a description of the compensation payable to the underwriters. |
To the extent that the underwriters sell more than shares of common stock, the underwriters have the option to purchase up to an additional shares from us at the initial public offering price less the underwriting discount.
The underwriters expect to deliver the shares against payment in New York, New York on , 2017.
| Goldman, Sachs & Co. |
Prospectus dated , 2017
| Page |
| 1 |
| 15 |
| 42 |
| INDUSTRY AND MARKET DATA AND CALCULATION OF KEY BUSINESS METRICS |
43 |
| 45 |
| 46 |
| 47 |
| 49 |
| 51 |
| MANAGEMENT’S DISCUSSION AND ANALYSIS OF FINANCIAL CONDITION AND RESULTS OF OPERATIONS |
53 |
| 75 |
| 90 |
| 97 |
| 104 |
| 107 |
| 109 |
| 115 |
| MATERIAL U.S. FEDERAL TAX CONSEQUENCES TO NON-U.S. HOLDERS OF OUR COMMON STOCK |
117 |
| 123 |
| 128 |
| 128 |
| 128 |
| F-1 |
We have not authorized anyone to provide any information or to make any representations other than those contained in this prospectus or in any free writing prospectuses we have prepared. We and the underwriters take no responsibility for, and can provide no assurance as to the reliability of, any other information that others may give you. This prospectus is an offer to sell only the shares offered hereby, but only under circumstances and in jurisdictions where it is lawful to do so. The information contained in this prospectus is accurate only as of the date of this prospectus, regardless of the time of delivery of this prospectus or of any sale of our common stock.
For investors outside of the United States: Neither we nor the underwriters have done anything that would permit this offering or possession or distribution of this prospectus in any jurisdiction where action for that purpose is required, other than in the United States. You are required to inform yourself about, and to observe any restrictions relating to, this offering and the distribution of this prospectus outside of the United States.
i
This summary highlights information presented in greater detail elsewhere in this prospectus. This summary is not complete and does not contain all the information you should consider before investing in our common stock. You should read the entire prospectus carefully, including “Risk Factors,” “Management’s Discussion and Analysis of Financial Condition and Results of Operations,” and our consolidated financial statements and related notes included elsewhere in this prospectus, before investing in our common stock.
Our Company
Redfin is a technology-powered residential real estate brokerage. We represent people buying and selling homes in over 80 markets throughout the United States. Our mission is to redefine real estate in the consumer’s favor.
Our strategy is simple. In a commission-driven industry, we put the customer first. We do this by pairing our own agents with our own technology to create a service that is faster, better, and costs less. We meet customers through our listings-search website and mobile application, reducing the marketing costs that can keep fees high. We let homebuyers schedule home tours with a few taps of a mobile-phone button, so it’s easy to try our service. We create an immersive online experience for every Redfin-listed home and then promote that listing to more buyers than any traditional brokerage can reach through its own website. We use machine learning to recommend listings better than any customer could find on her own. And we pay Redfin lead agents based in part on customer satisfaction, not just commission, so we’re on the customer’s side.
Our efficiency results in savings that we share with our customers. Our homebuyers saved on average approximately $3,500 per transaction in 2016. And we charge most home sellers a commission of 1% to 1.5%, compared to the 2.5% to 3% typically charged by traditional brokerages.
The results of our customer-first approach are clear. We:
| • | helped customers buy or sell more than 75,000 homes worth more than $40 billion; |
| • | gained market share in 81 of our 84 markets from 2015 to 2016; |
| • | drew more than 15 million monthly average visitors to our website and mobile application in 2016, 39% more than in 2015, making us the fastest-growing top-10 real estate website; |
| • | earned a Net Promoter Score, a measure of customer satisfaction, that is 61% higher than competing brokerages’, and a customer repeat rate that is 37% higher than competing brokerages’; |
| • | sold Redfin-listed homes for approximately $3,000 more on average compared to the list price than competing brokerages’ listings in 2016; and |
| • | employed lead agents who, in 2016, were on average three times more productive, and earned on average twice as much money as agents at competing brokerages; our lead agents were also 44% more likely to stay with us from 2015 to 2016 than agents at competing brokerages. |
1
And we’re just getting started. Because we’re one of the only major brokerages building virtually all of our own brokerage software, our gains in efficiency, speed, and quality are proprietary. Because our leadership and engineering teams have come from the technology industry, and have structured the business to invest in software development, we believe those software-driven gains are likely to grow over time. And finally, because we hire our own lead agents as employees, we can set data-driven best practices for selling homes, with our software tailored to those practices, creating a positive feedback loop between software and operational innovations that we believe differentiates us from traditional brokerages. Moreover, we believe listing more homes and drawing more homebuyers to our website and mobile application will let us pair homebuyers and home sellers directly online over time, further improving our service and lowering our costs.
Our growth has been significant. For the years ended December 31, 2014 and 2015, we generated revenue of $125.4 million and $187.3 million, respectively, representing annual growth of 37% and 49%, respectively. For the nine months ended September 30, 2015 and 2016, we generated revenue of $141.6 million and $200.4 million, respectively, representing year-over-year growth of 42%. We generated net losses of $24.7 million and $30.2 million for the years ended December 31, 2014 and 2015, respectively, and $21.5 million and $17.2 million for the nine months ended September 30, 2015 and 2016, respectively.
Real Estate Industry
In 2016, housing represented more than 25% of total investment dollars in the United States. The National Association of REALTORS®, or NAR, estimated that the aggregate value of existing U.S. home sales was approximately $1.5 trillion in 2016 from approximately 5.5 million total transactions. We estimate consumers paid more than $75 billion in commissions in 2016 for these transactions.
Highly Fragmented
The residential brokerage industry is highly fragmented. There are an estimated 2,000,000 active licensed agents and over 86,000 real estate brokerages in the United States, many operating through franchises or as small local brokerages. Our goal is to build the first large-scale brokerage that stands apart in consumers’ minds for delivering a unique and consistent customer experience where the value is in our brokerage and its technologies, not just a personal relationship with one agent.
Commission-Driven Compensation
Traditional real estate agents earn commissions based on a home’s sale price, with no direct consideration for customer satisfaction or service quality. We pay our lead agents a bonus based in part on customer satisfaction, not just commission. We do this to make our lead agents accountable not just for any sale, but for a sale on terms that satisfy our customer.
High Customer-Acquisition Costs
Traditional real estate agents spend significant amounts of time and money prospecting for customers through traditional advertising channels and networking activities. We believe that the Internet is more efficient at connecting consumers with agents than the prospecting activities of most agents, and that this efficiency gain can benefit the consumer most when a website is operated by the brokerage representing that consumer in a purchase or sale.
2
How We Win
Next-Generation Technologies
From stocks to books to lodging, technology has made it easier, faster, and less expensive to buy almost everything in our lives except the most important thing: our home.
To solve this problem, Redfin uses a wide range of next-generation technologies. We invented map-based real estate search. We use machine learning and artificial intelligence to answer customers’ most important questions about where to live, how much a home is worth, and when to move. We draw on cloud computing to perform computationally intensive comparisons of homes at a scale that would otherwise be cost prohibitive. We use streaming technologies to quickly notify customers about a listing. And we embrace new hardware, such as three-dimensional scanning cameras that let potential homebuyers walk through the property online.
The goal of all of these technologies is to empower our customers and increase our agents’ productivity. This leads to consistently better customer service at a lower cost. We pass the resulting savings to our customers.
Comprehensive Listings Data
As a brokerage, Redfin has complete access to all the homes listed for sale in the local multiple listing services, or MLSs, in the markets we serve. MLSs are used by real estate agents to list properties and coordinate sales. Although websites that do not operate a brokerage often have access to these MLSs, the terms of their access vary widely. As a result, brokerage websites often get more listings from MLSs, or more detail about each listing, than other websites.
Access to this extensive data, paired with local knowledge, lets us give our customers what we believe to be the most comprehensive information on homes for sale.
Additionally, our streaming architecture is designed to recommend listings to our customers by mobile alert or email soon after these listings appear in the MLS. These advantages in loading listings data and quickly notifying consumers come not just at the listing debut in the MLS, but in recognizing when a price changes or a home sells. For over 80% of these listings, we can show the listing on our website and mobile application within five minutes of its debut in the MLS.
Machine Learning
Redfin Listing Recommendations
Knowing which listings customers visit online, tour in person, or ultimately make an offer on lets our algorithms make better listing recommendations, further enhanced through curation by our lead agents.
Redfin Estimate
Our access to detailed data about every MLS listing in markets we serve has helped us build what we believe is the most accurate automated home-valuation tool. According to a 2017 study we
3
commissioned, among industry-leading websites that display valuations for active listings, 64% of the listings for which we provided a public valuation estimate sold within 3% of that estimate, compared to only 29% and 16% of the public estimates for the two other websites in the study.
Redfin Hot Homes
This proprietary algorithm identifies the homes we believe are most likely to sell quickly. Coupling Redfin Hot Homes alerts with on-demand tours, as well as data we’re collecting about offer deadlines, is part of our strategy to give our customers a first-mover advantage in pursuing the most desirable homes for sale.
On-Demand Service
Customers place a premium on speed. When we offer online visitors faster service, more try that service. Delivering this speed depends on seamless integration between our technology and service—to get customers into homes first, to prepare an offer first, to be able to win the deal, and to close without a hitch. Tracking every digital customer interaction and working in teams lets us provide fast, consistently high-quality service.
Teams and Tools
We believe that our ability to deliver better, faster service at lower cost depends not only on our ongoing software development, but also on organizing employees into teams using that software to respond faster than most individual agents could.
Teams of Employee Agents
Our lead agents are responsible for each customer’s success and are the customer’s primary point of contact. A lead agent typically meets the customer on a first tour or listing consultation and works with that customer throughout the buying or selling process. She is assisted by support agents for responding to initial online inquiries, by marketing assistants for getting a home photographed and promoted online and in printed fliers, and by transaction coordinators for closing paperwork.
Our entire team of employees follows processes and uses software developed by Redfin to ensure consistent, high-quality service, based on data-driven insights about how to schedule tours, when to check in with customers, and how to price a home.
Flexible Network of Independent Associate Agents
We also contract with independent associate agents to create a flexible network of licensed real estate agents to deliver faster service for customer tours, open houses, and inspections.
Redfin Agent Tools
Our proprietary Redfin Agent Tools automatically captures information on millions of customer interactions every year, and provides templates for our lead agents to recommend listings, follow up on tours, prepare comparative market analyses, and write offers. Our employee agents can access Redfin Agent Tools on their mobile device, so we can serve customers better and faster, even when our agents are in the field rather than at their desks.
4
Productive Agents
Our lead in website traffic among major brokerages has a profound effect not just on our economics but on our culture: our lead agents’ primary responsibility is not selling our services, but advising customers buying and selling homes. In 2016, our lead agents were on average three times more productive and earned on average twice as much money as agents at competing brokerages.
Data guides our hiring and management decisions, as we’ve analyzed which industry hires out perform those new to real estate and what level of prior experience is correlated with long tenure at our company. We measure agent performance in detail and give managers access to this data in real time, so we can quickly intervene when our customer service falls short.
Investment in Agents
The high productivity of our lead agents rationalizes an investment in equipment, management, training, and support staff that is unusual in the industry: we pay for all of our employee agents’ equipment, dues, and marketing expenses, and we provide training for each new hire, with a multi-week course for agents in our largest markets. We believe that the combined effect of these investments is more productive lead agents and better customer service.
Redfin Partner Program
To serve customers when our own agents can’t due to high demand, we’ve developed partnerships with over 2,900 agents at other brokerages. Once we refer a customer to a partner agent, that agent, not us, represents the customer from the initial meeting through closing, at which point the agent pays us a portion of her commission as a referral fee. As part of our commitment to low fees, we directly issue the customer a $500 check in connection with the purchase or sale of any home costing more than $200,000.
Rather than countering seasonal and cyclical changes in demand by recruiting a surplus of agents, we rely on partner agents to handle demand swings. We built our partner program so our lead agents can deliver consistently high-quality service at busy times, and so we can limit the effect of fixed expenses when demand falters.
Homebuyer Experience
We seek to provide every homebuyer with fast service, low fees, and an agent completely on that buyer’s side. Our lead agents can join each homebuyer’s online search, commenting on the buyer’s favorite listings, answering questions, or recommending listings the buyer might have overlooked. With a few taps of a mobile-phone button, a Redfin homebuyer can schedule home tours before many buyers even realize those homes are for sale. Our lead agent hosting the tour earns bonuses based on customer reviews, not just commissions, encouraging the candor customers need to make the best decision about which home to buy.
We recently introduced an instant-offer capability in selected markets: on the front steps of a listing the customer likes, our lead agent uses our technology to draft an offer from her phone in minutes, with the goal of beating competing buyers to the punch. During the inspections and appraisals, we track contracts and tasks in an online deal room to keep the closing on schedule.
5
Home Seller Experience
We seek to give every home seller honest advice on how to price her property; the best marketing, primarily online; and the lowest fees. Our industry-leading algorithms for calculating what a home is worth lead to a better pricing recommendation in the initial consultation. We believe this is one reason Redfin listings sell for more relative to the list price than other brokers’, and are more likely to sell in the first 90 days on market.
To increase demand, we film an interactive, three-dimensional virtual scan of the home and we promote each Redfin listing on our website and mobile application. We drive additional demand through targeted email as well as other channels like Facebook, using advanced algorithms to promote the listing to the right homebuyers. We also share the listing with every major real estate website. An online dashboard tracks traffic to the listing and an iPad application registers in-person visits to open houses, so our home sellers make better decisions about pricing, marketing, and offer negotiations.
We believe listing more homes and drawing more homebuyers to our website and mobile application will let us pair homebuyers and home sellers directly online over time, further improving our service and lowering our costs.
Our Value Proposition
Customers Get Better Service
Our Net Promoter Score is 53, compared to the industry average of 33, as measured by a third-party research firm in 2016.
Measurable Results
Redfin listings were on the market for an average of 29 days in 2016 compared to the industry average of 35 days according to a study by a third-party research firm. And over 74% of Redfin listings sold within 90 days versus the industry average of approximately 69% according to the same study.
Customers Save Money
We give homebuyers a portion of the commissions that we earn. We typically earn 2.5% to 3% of a home’s value for representing a homebuyer, and we contributed an average of approximately $3,500 per transaction through a commission refund or a closing-cost reduction in 2016.
Consumers selling a home with a traditional brokerage typically pay total commissions of 5% to 6% of the sale price, with 2.5% to 3% going to their agent and another 2.5% to 3% to the agent representing the buyer. Redfin home sellers typically pay only 1% to 1.5% of their home’s sale price to us, depending on the market and subject to market-by-market minimums. So we can readily sell our listings to any homebuyer, including a buyer represented by a competing brokerage, we typically recommend that our home sellers still offer a 2.5% to 3% commission to the buyer’s agent. As a result, we typically save our home sellers 1% to 2% of the total sales prices on average listing fees.
Our Culture of Service and Thrift
Service is fundamental to our “everyone-sweeps-the-floors” culture: our executives serve our employees, and our employees serve our customers. As part of this humility, we recognize that
6
everyone can be a leader. An agent can imagine better software; an engineer can imagine better service. The only way we can use technology to make real estate better is by working together, in a way we believe that few pure technology or pure service companies can.
Another tenet of our culture is thrift. We may be a next-generation real estate brokerage, but we’re old-fashioned about stockholder value. We continued to grow through the darkness of the 2008 real estate crisis as we fought to make a margin-sensitive, headcount-intensive business work with the resources we had. Next week, next year, some day, that darkness will return, and we believe that our formative experiences will make us better prepared for it than others.
Growth Strategies
Grow Share in Existing Markets
We have a strong track record of gaining share across nearly all of our markets, including the markets open more than a decade. We have studied cohorts of our markets opened in similar timeframes. We have gained market share, increased real estate revenue, and increased real estate gross margin in all of the cohorts in each of the years studied. Our year-to-year market share gains have been largely consistent across cohorts.
As we gain local market share, our service gets even better. By doing more transactions in a smaller area, agents increase their local knowledge. We capture more customer-interaction data, powering analytics such as our listing recommendation engine. Potential customers see our yard signs more often and hear from other customers about our service. We believe these factors fuel further market share gains.
We believe listing share lets us provide better online search results, because we post Redfin listings to our website first in many markets, with exclusive photos about each listing. We further believe that as we gain share, more homebuyers will want to work with us to gain access to our listings, and we’ll get more listings from owners seeking access to our homebuyers. As this flywheel starts turning, we plan to invest more to connect homebuyers and home sellers directly.
We believe transactions from our repeat customers will continue to play a larger role in our market share gains. According to NAR, homeowners sell their homes every nine years on average, suggesting that repeat business takes a long time to build. At Redfin, we’re now seeing our customers come back to sell a home we helped them buy many years before. The rate at which our customers return to us for another transaction is 37% higher than the industry average. With tens of thousands of new customers each year, and higher rates of customer satisfaction, we believe we can drive future share gains as those customers choose to work with us again.
Offer a Complete Solution
We’re planning new services to become an end-to-end solution for customers buying and selling a home. Our experience with Title Forward, our title and settlement business, demonstrates that many Redfin customers are open to buying more services from us. In 2016, in the six states where Title Forward operated, 56% of our homebuyers also chose our title and settlement service. In 2017, we plan to begin originating and underwriting loans through Redfin Mortgage. Our goal is to build technology for Redfin Mortgage that will ultimately support a completely digital closing, leading to efficiency gains for our brokerage, title, and mortgage businesses.
7
Selected Risks Associated with Our Business
Our business is subject to numerous risks and uncertainties, including those highlighted under “Risk Factors” immediately following this prospectus summary. These risks include:
| • | we operate in a seasonal and cyclical industry, and we’re negatively affected by industry downturns; |
| • | we have a history of losses, and we may never be consistently profitable; |
| • | our business is concentrated in certain geographic markets, and any disruptions in those markets could harm our business; |
| • | our future market share gains may take longer than expected and cause us to incur significant costs; |
| • | our revenue and results of operations may fluctuate on a quarterly and annual basis; |
| • | our business model and growth strategy depend on our ability to attract homebuyers and home sellers to our website and mobile application efficiently; |
| • | we must provide our customers comprehensive and accurate real estate listings quickly; |
| • | we must comply with the rules, terms of service, and policies of numerous MLSs; |
| • | competition in our industry is intense and our business model subjects us to challenges our competitors do not face; |
| • | we are subject to an increasing variety of federal and state laws and regulations that increase our compliance costs and could subject us to claims; and |
| • | we are subject to litigation risks. |
Corporate Information
We were incorporated as Appliance Computing Inc. in Washington in October 2002. We reincorporated in February 2005 in Delaware and changed our name to Redfin Corporation in May 2006. Our principal executive offices are located at 1099 Stewart St., Suite 600, Seattle, Washington 98101, and our telephone number is (206) 576-8333. Our website address is www.redfin.com. Information contained on, or that can be accessed through, our website is not incorporated by reference into this prospectus, and you should not consider information on our website to be part of this prospectus. Investors should not rely on any such information in deciding whether to purchase our common stock.
Unless the context indicates otherwise, as used in this prospectus, the terms “Redfin,” the “Company,” “we,” “us,” and “our” refer to Redfin Corporation, a Delaware corporation, and its subsidiaries taken as a whole, unless otherwise noted.
Redfin, the Redfin logo, Redfin Estimate, Title Forward, Walk Score, and other registered or common law trade names, trademarks, or service marks of Redfin appearing in this prospectus are
8
Redfin’s property. This prospectus contains additional trade names, trademarks, and service marks of other companies that are not owned by Redfin. We do not intend our use or display of other companies’ trade names, trademarks or service marks to imply a relationship with, or endorsement or sponsorship of us by, these other companies. Solely for convenience, our trademarks and trade names referred to in this prospectus appear without the ® and ™ symbols, but those references are not intended to indicate, in any way, that we will not assert, to the fullest extent under applicable law, our rights, or the right of the applicable licensor, to these trademarks and trade names.
Implications of Being an Emerging Growth Company
We are an “emerging growth company” as defined in Section 2(a) of the Securities Act of 1933, as amended, or the Securities Act, as modified by the Jumpstart Our Business Startups Act of 2012, or the JOBS Act. As an emerging growth company, we may take advantage of specified reduced disclosure and other requirements that are otherwise applicable, in general, to public companies that are not emerging growth companies. These provisions include:
| • | being permitted to present only two years of audited financial statements and only two years of related “Management’s Discussion and Analysis of Financial Condition and Results of Operations” in this prospectus; |
| • | not being required to comply with the auditor attestation requirement on the effectiveness of our internal control over financial reporting; |
| • | not being required to comply with any requirement that may be adopted by the Public Company Accounting Oversight Board regarding mandatory audit firm rotation or a supplement to the auditor’s report providing additional information about the audit and the financial statements (auditor discussion and analysis); |
| • | reduced disclosure about our executive compensation arrangements; and |
| • | exemptions from the requirements to obtain a non-binding advisory vote on executive compensation or a stockholder approval of any golden parachute arrangements. |
We may take advantage of these exemptions for up to five years or such earlier time that we are no longer an emerging growth company. Accordingly, the information contained herein may be different than the information you receive from other public companies in which you hold stock. We would cease to be an emerging growth company upon the earliest to occur of (1) the last day of the fiscal year in which we have more than $1.0 billion in annual revenue, (2) the date we qualify as a “large accelerated filer,” with at least $700 million of equity securities held by non-affiliates, (3) the date on which we have issued more than $1.0 billion in non-convertible debt securities during the prior three-year period, and (4) December 31, 2022 (the last day of the fiscal year ending after the fifth anniversary of this offering).
In addition, the JOBS Act also provides that an emerging growth company can utilize extended transition periods for complying with new or revised accounting standards. Thus, an emerging growth company can delay the adoption of certain accounting standards until those standards would otherwise apply to private companies. We have irrevocably elected not to avail ourselves of this exemption and, therefore, we will be subject to the same new or revised accounting standards as other public companies that are not emerging growth companies.
9
The Offering
| Common stock offered |
shares |
| Option to purchase additional shares of common stock |
shares |
| Common stock to be outstanding after this offering |
shares ( shares, if the underwriters exercise their option to purchase additional shares in full) |
| Use of proceeds |
We estimate that the net proceeds from the sale of shares of common stock in this offering will be approximately $ million (or approximately $ million if the underwriters exercise their option to purchase additional shares in full), based on an assumed initial public offering price of $ per share, which is the midpoint of the price range set forth on the cover page of this prospectus, and after deducting the estimated underwriting discount and estimated offering expenses. |
| We intend to use the net proceeds that we receive from this offering for working capital and other general corporate purposes, including technology and development and marketing activities, general and administrative matters, and capital expenditures. We may also use a portion of the net proceeds to invest in or acquire third-party businesses, products, services, technologies, or other assets. See “Use of Proceeds.” |
| Risk factors |
You should read the “Risk Factors” section of this prospectus for a discussion of factors to consider carefully before deciding to invest in shares of our common stock. |
| Proposed symbol |
“RDFN” |
The number of shares of our common stock to be outstanding after this offering is based on 209,800,686 shares of our common stock outstanding as of September 30, 2016, and excludes:
| • | 38,040,107 shares of our common stock issuable upon the exercise of options outstanding as of September 30, 2016, with a weighted-average exercise price of $1.87 per share; |
| • | 2,827,713 shares of our common stock issuable upon the exercise of options that were granted after September 30, 2016, with an exercise price of $2.82 per share; and |
| • | shares of our common stock reserved for future issuance under our stock-based compensation plans, consisting of (1) 17,185,755 shares of our common stock reserved for future issuance under our Amended and Restated 2004 Equity Incentive Plan, which shares will be added to the shares to be reserved under our 2017 Equity Incentive Plan in connection with this offering, and (2) shares of our common stock reserved for future issuance under our 2017 Equity Incentive Plan, which will become effective in connection with this offering. |
10
Except as otherwise indicated, all information in this prospectus assumes:
| • | the automatic conversion of all outstanding shares of our redeemable convertible preferred stock as of September 30, 2016 into an aggregate of 166,266,114 shares of our common stock, which will occur upon the completion of this offering; |
| • | a -for- reverse stock split of our common stock, effective on ; |
| • | the effectiveness of our restated certificate of incorporation and restated bylaws upon the completion of this offering; |
| • | no exercise of outstanding options after September 30, 2016; and |
| • | no exercise of the underwriters’ option to purchase additional shares of our common stock. |
11
Summary Consolidated Financial Data
The following tables summarize our consolidated financial data. We have derived the following consolidated statements of operations data for the years ended December 31, 2014 and 2015 from our audited consolidated financial statements that are included elsewhere in this prospectus. We derived our summary consolidated statements of operations data for the nine months ended September 30, 2015 and 2016 and our summary consolidated balance sheet data as of September 30, 2016 from our unaudited interim consolidated financial statements included elsewhere in this prospectus. Our unaudited interim consolidated financial statements have been prepared in accordance with U.S. generally accepted accounting principles, or GAAP, on the same basis as our audited annual consolidated financial statements and, in the opinion of management, reflect all adjustments, consisting only of normal, recurring adjustments, that are necessary for the fair presentation of our consolidated financial position as of September 30, 2016 and our consolidated results of operations for the nine months ended September 30, 2015 and 2016. Our historical results are not necessarily indicative of the results that may be expected for any future period, and the results for the nine months ended September 30, 2016 are not necessarily indicative of the results to be expected for the full year or any other period. The following summary consolidated financial data should be read in conjunction with “Management’s Discussion and Analysis of Financial Condition and Results of Operations” and our consolidated financial statements, the accompanying notes and other financial information included elsewhere in this prospectus.
| Year Ended December 31, | Nine Months Ended September 30, |
|||||||||||||||
| 2014 | 2015 | 2015 | 2016 | |||||||||||||
| (in thousands, except share and per share data) | ||||||||||||||||
| Consolidated Statements of Operations Data: |
||||||||||||||||
| Revenue |
$ | 125,363 | $ | 187,338 | $ | 141,605 | $ | 200,414 | ||||||||
| Cost of revenue(1) |
93,272 | 138,492 | 103,474 | 138,955 | ||||||||||||
|
|
|
|
|
|
|
|
|
|||||||||
| Gross profit |
32,091 | 48,846 | 38,131 | 61,459 | ||||||||||||
|
|
|
|
|
|
|
|
|
|||||||||
| Operating expenses: |
||||||||||||||||
| Technology and development(1) |
17,876 | 27,842 | 20,383 | 25,739 | ||||||||||||
| Marketing(1) |
15,058 | 19,899 | 15,011 | 23,133 | ||||||||||||
| General and administrative(1) |
24,240 | 31,394 | 24,237 | 29,948 | ||||||||||||
|
|
|
|
|
|
|
|
|
|||||||||
| Total operating expenses |
57,174 | 79,135 | 59,631 | 78,820 | ||||||||||||
|
|
|
|
|
|
|
|
|
|||||||||
| Income (loss) from operations |
(25,083 | ) | (30,289 | ) | (21,500 | ) | (17,361 | ) | ||||||||
|
|
|
|
|
|
|
|
|
|||||||||
| Interest income and other income, net: |
||||||||||||||||
| Interest income |
23 | 46 | 27 | 133 | ||||||||||||
| Other income, net |
24 | 7 | 8 | 37 | ||||||||||||
|
|
|
|
|
|
|
|
|
|||||||||
| Total interest income and other income, net |
47 | 53 | 35 | 170 | ||||||||||||
|
|
|
|
|
|
|
|
|
|||||||||
| Income (loss) before tax benefit (expense) |
(25,036 | ) | (30,236 | ) | (21,465 | ) | (17,191 | ) | ||||||||
| Income tax benefit (expense) |
306 | — | — | — | ||||||||||||
|
|
|
|
|
|
|
|
|
|||||||||
| Net Income (loss) |
$ | (24,730 | ) | $ | (30,236 | ) | $ | (21,465 | ) | $ | (17,191 | ) | ||||
|
|
|
|
|
|
|
|
|
|||||||||
| Accretion of preferred stock |
(101,251 | ) | (102,224 | ) | (48,811 | ) | 56,819 | |||||||||
| Undistributed earnings attributable to participating securities |
— | — | — | (31,483 | ) | |||||||||||
|
|
|
|
|
|
|
|
|
|||||||||
| Net income (loss) attributable to common stock—basic |
$ | (125,981 | ) | $ | (132,460 | ) | $ | (70,276 | ) | $ | 8,145 | |||||
|
|
|
|
|
|
|
|
|
|||||||||
| Net income (loss) attributable to common stock—diluted |
$ | (125,981 | ) | $ | (132,460 | ) | $ | (70,276 | ) | $ | (17,191 | ) | ||||
|
|
|
|
|
|
|
|
|
|||||||||
12
| Net income (loss) per share attributable to common stock—basic(2) |
$ | (3.92 | ) | $ | (3.29 | ) | $ | (1.77 | ) | $ | 0.19 | |||||
|
|
|
|
|
|
|
|
|
|||||||||
| Net income (loss) per share attributable to common stock—diluted(2) |
$ | (3.92 | ) | $ | (3.29 | ) | $ | (1.77 | ) | $ | (0.08 | ) | ||||
|
|
|
|
|
|
|
|
|
|||||||||
| Weighted average shares used to compute net income (loss) per share attributable to common stock—basic(2) |
32,150,025 | 40,249,762 | 39,669,071 | 43,017,478 | ||||||||||||
|
|
|
|
|
|
|
|
|
|||||||||
| Weighted average shares used to compute net income (loss) per share attributable to common stock—diluted |
32,150,025 | 40,249,762 | 39,669,071 | 209,288,537 | ||||||||||||
|
|
|
|
|
|
|
|
|
|||||||||
| Pro forma net income (loss) per share attributable to common stock—basic and diluted (unaudited)(2) |
$ | (0.15 | ) | $ | (0.08 | ) | ||||||||||
|
|
|
|
|
|||||||||||||
| Pro forma weighted average shares used to compute net loss per share attributable to common stock—basic and diluted (unaudited) |
206,515,876 | 209,283,592 | ||||||||||||||
|
|
|
|
|
| (1) | Includes stock-based compensation as follows: |
| Year Ended December 31, | Nine Months Ended September 30, |
|||||||||||||||
| 2014 | 2015 | 2015 | 2016 | |||||||||||||
| (in thousands) | ||||||||||||||||
| Cost of revenue |
$ | 1,280 | $ | 1,440 | $ | 985 | $ | 1,589 | ||||||||
| Technology and development |
962 | 1,375 | 971 | 1,653 | ||||||||||||
| Marketing |
237 | 298 | 208 | 336 | ||||||||||||
| General and administrative |
2,717 | 2,449 | 1,881 | 2,312 | ||||||||||||
|
|
|
|
|
|
|
|
|
|||||||||
| Total |
$ | 5,196 | $ | 5,562 | $ | 4,045 | $ | 5,890 | ||||||||
|
|
|
|
|
|
|
|
|
|||||||||
| (2) | See Note 7 to our consolidated financial statements included elsewhere in this prospectus for an explanation of the calculations of our net income (loss) per share attributable to common stock, basic and diluted, and pro forma net income (loss) per share attributable to common stock, basic and diluted. |
| As of September 30, 2016 | ||||||||||||
| Actual | Pro Forma(1) | Pro Forma As Adjusted(2)(3) |
||||||||||
| (in thousands) | ||||||||||||
| Consolidated Balance Sheet Data: |
||||||||||||
| Cash, cash equivalents, and short-term investments |
$ | 76,771 | $ | 76,771 | $ | |||||||
| Working capital |
66,623 | 66,623 | ||||||||||
| Total assets |
128,954 | 128,954 | ||||||||||
| Redeemable convertible preferred stock |
543,095 | — | ||||||||||
| Total stockholders’ equity (deficit) |
(449,069 | ) | 94,026 | |||||||||
| (1) | The pro forma column reflects the automatic conversion of all outstanding shares of our redeemable convertible preferred stock as of September 30, 2016 into an aggregate of 166,266,114 shares of common stock, which conversion will occur immediately upon the completion of this offering. |
| (2) | The pro forma as adjusted column gives effect to (a) the pro forma adjustments set forth above and (b) the sale and issuance by us of shares of our common stock in this offering, based upon an assumed initial public offering price of $ per share, which is the midpoint of the price range set forth on the cover page of this prospectus, after deducting the estimated underwriting discount and estimated offering expenses. |
13
| (3) | Each $1.00 increase (decrease) in the assumed initial public offering price of $ per share, which is the midpoint of the price range set forth on the cover page of this prospectus, would increase (decrease) our cash, cash equivalents and short-term investments, working capital, total assets, and total stockholders’ equity by approximately $ million, assuming that the number of shares offered by us, as set forth on the cover page of this prospectus, remains the same and after deducting the estimated underwriting discount. Similarly, each increase (decrease) of one million shares in the number of shares offered by us would increase (decrease) our cash, cash equivalents and short-term investments, working capital, total assets, and total stockholders’ equity by approximately $ million, assuming the assumed initial public offering price, which is the midpoint of the price range set forth on the cover page of this prospectus, remains the same and after deducting the estimated underwriting discount. |
14
An investment in our common stock involves a high degree of risk. You should carefully consider the risks and uncertainties described below, together with all of the other information in this prospectus, including “Management’s Discussion and Analysis of Financial Condition and Results of Operations” and our consolidated financial statements and related notes, before deciding to invest in our common stock. Our business, operating results, financial condition, or prospects could be materially and adversely affected by any of these risks and uncertainties. If any of these risks occurs, the trading price of our common stock could decline and you might lose all or part of your investment. Our business, operating results, financial performance, or prospects could also be harmed by risks and uncertainties not currently known to us or that we currently do not believe are material.
Risks Related to Our Business and Industry
The U.S. residential real estate industry is seasonal and cyclical, and we‘re negatively affected by industry downturns.
Our success depends largely on the health of the U.S. residential real estate industry, which is seasonal, cyclical, and affected by changes in general economic conditions beyond our control. Any of the following macroeconomic factors could adversely affect demand for residential real estate, result in falling home prices and harm our business:
| • | increased interest rates; |
| • | increased unemployment rates or stagnant or declining wages; |
| • | slow economic growth or recessionary conditions; |
| • | weak credit markets; |
| • | low consumer confidence in the economy or the U.S. residential real estate industry; |
| • | adverse changes in local or regional economic conditions in the markets that we serve; |
| • | fluctuations in local and regional home inventory levels; |
| • | constraints on the availability of mortgage financing, enhanced mortgage underwriting standards or increased down payment requirements; |
| • | federal and state legislative, tax or regulatory changes that would adversely affect the U.S. residential real estate industry, including potential reform relating to Fannie Mae, Freddie Mac and other government sponsored entities that provide liquidity to the mortgage market, and limitations on the deductions of certain mortgage interest expenses; |
| • | increases in the exchange rate for the U.S. dollar compared to foreign currencies, causing U.S. real estate to be more expensive for foreign purchasers; |
| • | foreign regulatory changes or capital controls that would make it more difficult for foreign purchasers to withdraw capital from their home countries or purchase and hold U.S. real estate; |
| • | strength of financial institutions; |
15
| • | high levels of foreclosure activity in particular markets; |
| • | a decrease in home ownership rates; |
| • | political uncertainty relating to the new presidential administration; or |
| • | acts of nature, such as hurricanes, earthquakes and other natural disasters, as well as adverse environmental and climate changes that disrupt the local or regional real estate markets we serve. |
We have a history of losses, and we may not achieve or maintain profitability in the future.
We have not been profitable on an annual basis since we were founded, and as of September 30, 2016, we had an accumulated deficit of $487.1 million. We expect to continue to make future investments in developing and expanding our business, including technology, recruitment and training, marketing, and pursuing strategic opportunities. These investments may not result in increased revenue or growth in our business. Additionally, we may incur significant losses in the future for a number of reasons, including:
| • | our inability to grow market share; |
| • | increased competition in the U.S. residential real estate industry; |
| • | changes in our commission rates; |
| • | our failure to realize our anticipated efficiency through our technology and business model; |
| • | failure to execute our growth strategies; |
| • | declines in the U.S. residential real estate industry; and |
| • | unforeseen expenses, difficulties, complications and delays, and other unknown factors. |
Accordingly, we may not be able to achieve or maintain profitability and we may continue to incur significant losses in the future.
Our business is concentrated in certain geographic markets. Failing to grow in those markets or any disruptions in those markets could harm our business.
For 2015 and the nine months ended September 30, 2016, approximately 75% and 72% of our real estate revenue, respectively, was derived from our top-10 markets. These markets are primarily major metropolitan areas, where home prices and transaction volumes are generally higher than other markets. Local and regional economic conditions in these markets differ materially from prevailing conditions in other parts of the United States. In addition, due to the higher home prices in these markets, our real estate revenue and gross margin is generally higher in these markets than in our smaller markets. Any overall or disproportionate downturn in demand or economic conditions in any of our largest markets, particularly if we are not able to increase revenue from our other markets, could result in a decline in our revenue and harm our business.
Our future market share gains may take longer than planned and cause us to incur significant costs.
We represent people buying and selling homes in over 80 markets throughout the United States. We have a limited operating history in many of these markets. Expanding our services in
16
existing and new markets and increasing the depth and breadth of our presence imposes significant burdens on our marketing, compliance, and other administrative and managerial resources. Our plan to expand and deepen our market share in our existing markets and possibly expand into additional markets is subject to a variety of risks and challenges. These risks and challenges include the varying economic and demographic conditions of each market, competition from local and regional residential brokerage firms, variations in transaction dynamics, and pricing pressures. Additionally, our earlier markets typically have higher mean home prices than our more recent markets. In addition, many valuable markets have established residential brokerages with superior local referral networks, name recognition, and perceived local knowledge and expertise. If we cannot manage our expansion efforts efficiently, our market share gains could take longer than planned and our related costs could exceed our expectations. In addition, we could incur significant costs to seek to expand our market share, and still not succeed in attracting sufficient customers to offset such costs.
We expect our revenue and results of operations to fluctuate on a quarterly and annual basis.
Our revenue and results of operations are likely to vary significantly from period to period and may fail to match expectations as a result of a variety of factors, many of which are outside our control. The other risk factors discussed in this “Risk Factors” section may contribute to the variability of our quarterly and annual results. In addition, our revenue and results may fluctuate as a result of:
| • | seasonal variances of home sales, which historically peak during the summer and are weaker during the first and fourth quarters of each year; |
| • | cyclical periods of slowdowns or recessions in the U.S. real estate market; |
| • | our ability to increase market share; |
| • | fluctuations in sale prices and transaction volumes in our top markets; |
| • | the price of homes bought or sold by Redfin homebuyers and home sellers; |
| • | price competition; |
| • | volume of transactions in markets with a higher than average mean home price; |
| • | mix of transactions; |
| • | impairment charges associated with goodwill and other intangible assets; |
| • | the timing and success of new offerings by us and our competitors; |
| • | changes in local market conditions; |
| • | changes in interest rates and the mortgage and credit markets; |
| • | the time it takes new lead agents to become fully productive; |
| • | changes in federal, state or local laws or taxes that affect real estate transactions or residential brokerage, title insurance, and mortgage insurance industries; |
17
| • | changes in multiple listing services, or MLSs, or other rules and regulations affecting the residential real estate industry; and |
| • | any acquisitions of, or investments in, third-party technologies or businesses. |
As a result of potential variations in our revenue and results of operations, period-to-period comparisons may not be meaningful and the results of any one period should not be relied on as an indication of future performance. In addition, our results of operations may not meet the expectations of investors or public market analysts who follow us, which may adversely affect our stock price.
Our business model and growth strategy depend on our ability to attract homebuyers and home sellers to our website and mobile application in a cost-effective manner.
Our success depends on our ability to attract homebuyers and home sellers to our website and mobile application in a cost-effective manner. Our website and mobile application are our primary channels for meeting customers. We rely heavily on organic traffic generated from search engines and other unpaid sources to meet customers. We use a variety of media in our marketing efforts, including online and television advertising and social media, to drive traffic. We intend to continue to invest resources in our marketing efforts.
We are heavily dependent on digital marketing initiatives such as search engine optimization to improve our website’s search result ranking and generate new customer leads. We also rely on other marketing methods such as social media marketing, paid search advertising and targeted email communications. Advertising platforms, such as Facebook, Google, and others, may raise their rates significantly, and we may choose to use alternative and less expensive channels, which may not be as effective at attracting homebuyers and home sellers to our website and mobile application. We also use television advertising, which may have significantly higher costs than other channels. In addition, we may be required to expand into or continue to invest in more expensive channels than those we are currently in, which could harm our business.
These marketing efforts may not succeed for a variety of reasons, including changes to search engine algorithms, ineffective campaigns across marketing channels, and limited experience in certain marketing channels like television. External factors beyond our control may also affect the success of our marketing initiatives, such as filtering of our targeted communications by email servers, homebuyers and home sellers failing to respond to our marketing initiatives, and competition from third parties. Any of these factors could reduce the number of homebuyers and home sellers to our website and mobile application. We also anticipate that our marketing efforts will become increasingly expensive as competition increases and we seek to expand our business in existing markets. Generating a meaningful return on our marketing initiatives may be difficult. If our strategies do not attract homebuyers and home sellers efficiently, our business and growth would be harmed. Even if we successfully increase revenue as a result of these efforts, that additional revenue may not offset the related expenses we incur.
We rely heavily on Internet search engines and mobile application stores to direct traffic to our website and our mobile application, respectively.
We rely heavily on Internet search engines, such as Google, Bing and Yahoo!, to drive traffic to our website and on mobile application stores, such as Apple iTunes Store and the Android Play Store, for downloads of our mobile application. The number of visitors to our website and mobile application downloads depends in large part on how and where our website and mobile application rank in Internet search results and mobile application stores, respectively. For example, when a user types a property address into an Internet search engine, we rely on that search engine to rank our
18
webpages in the search results and to direct a user to the listing on our website. While we use search engine optimization to help our webpages rank highly in search results, maintaining our search result rankings is not within our control. Internet search engines frequently update and change their ranking algorithms, referral methodologies, or design layouts, which determine the placement and display of a user’s search results. In some instances, Internet search engines may change these rankings in order to promote their own competing services or the services of one or more of our competitors. Similarly, mobile application stores can change how they display searches and how mobile applications are featured. For instance, editors at the Apple iTunes Store can feature prominently editor-curated mobile applications and cause the mobile application to appear larger than other applications or more visibly on a featured list. Listings on our website and mobile application have experienced fluctuations in search result and mobile application rankings in the past, and we anticipate fluctuations in the future. If our website or listings on our website fail to rank prominently in Internet search results, our website traffic could decline. Likewise, a decline in our website and mobile application traffic could reduce the number of customers for our services.
If we cannot obtain and provide to our customers comprehensive and accurate real estate listings quickly, or at all, our business will suffer.
Our ability to attract consumers to our website and mobile application is heavily dependent on our timely access to comprehensive and accurate real estate listings data. We get listings data primarily from MLSs in the markets we serve. We also source listings data from public records, other third-party listing providers, and individual homeowners and brokers. Many of our competitors and other real estate websites also have access to MLSs and other listings data, including proprietary data, and may be able to source listings data or other real estate information faster or more efficiently than we can. Since MLS participation is voluntary, brokers and homeowners may decline to post their listings data to their local MLS or may seek to change or limit the way that data is distributed. A competitor or another industry participant could also create an alternative listings data service, which may reduce the relevancy and comprehensive nature of the MLSs. If MLSs cease to be the predominant source of listings data in the markets that we serve, we may be unable to get access to comprehensive listings data on commercially reasonable terms, or at all, and we may be unable to provide timely listings to our customers.
If we do not comply with the rules, terms of service, and policies of MLSs, our access to and use of listings data may be restricted or terminated and harm our business.
We must comply with each MLS’s rules, terms of service, and policies to access and use its listings data. Each of the more than 115 MLSs we belong to has adopted its own rules, terms of service and policies governing, among other things, how MLS data may be used and listings data must be displayed on our website and mobile application. These rules typically do not contemplate multi-jurisdictional online brokerages like ours and vary widely among markets. They also are in some cases inconsistent with the rules of other MLSs such that we are required to customize our website, mobile application, or service to accommodate differences between MLS rules. Complying with the rules of each MLS requires significant investment, including personnel, technology and development resources, other resources, and the exercise of considerable judgment. If we are deemed to be noncompliant with an MLS’s rules, we may face disciplinary sanctions in that MLS, which could include monetary fines, restricting, terminating our access to that MLS’s data or other disciplinary measures. The loss or degradation of this listings data could materially and adversely affect traffic to our website and mobile application, making us less relevant to consumers and restricting our ability to attract customers. It also could reduce agent and customer confidence in our services and harm our business.
19
Our business model subjects us to challenges not faced by our competitors.
Unlike most of our brokerage competitors, we hire our lead agents as employees, rather than as independent contractors, and therefore we incur related costs that our brokerage competitors do not, such as base pay, employee benefits, expense reimbursement, training, and employee transactional support staff. We also continue to invest heavily in developing our technology as well as new offerings. As a result, we have significant costs, some of which we incur in anticipation of future growth in revenue and market share. In the event of fluctuations in demand in the markets we serve, or significant reductions in home sales’ prices, whether due to seasonality, cyclicality, changes in interest rates, fiscal policy, or other events, we will not be able to adjust our expenses as rapidly as many of our competitors, and our business would be harmed. Additionally, due to these costs, our lead agent turnover may be more costly to us than to traditional brokerages, and our business may be harmed if we are unable to achieve the necessary level of lead agent productivity and retention to offset their related costs.
Competition in the residential brokerage industry is intense and if we cannot compete effectively, our business will suffer.
We face intense competition nationally and in each of the markets we serve. We compete primarily against other residential brokerages, which include operations affiliated with national or local brands and small independent brokerages. We also compete with a growing number of Internet-based residential brokerages and others who operate with non-traditional real estate business models. Competition with brokerages is particularly intense in some of the densely populated metropolitan markets we serve. To capture and retain market share, we must compete successfully against other brokerages, not only for customers, but also for high-performing lead agents and other critical employees.
The residential brokerage industry has low barriers to entry for new participants, including other technology-driven brokerages that offer lower commissions than the traditional pricing model. We may change our pricing strategies in response to a number of factors, including competitive pressures or in response to transaction volume fluctuations in particular markets we serve. As competitors introduce new offerings that compete with ours or reduce their commission rates, we may need to change our pricing strategies to compete effectively. Any such changes, particularly in the top-10 markets we serve, may affect our ability to compete successfully and harm our business.
Many of our brokerage competitors have substantial competitive advantages, such as longer operating histories, greater financial resources, stronger brand recognition, more management, sales, marketing and other resources, and extensive relationships with participants in the residential real estate industry including third-party data providers such as MLSs. Consequently, these brokerages may have an advantage in recruiting and retaining agents, attracting consumers, acquiring customers and growing their businesses. They may be able to provide consumers with offerings that are different from or superior to those we provide. They may also be acquired by third parties with greater resources than ours, which would further strengthen and enable them to compete more vigorously or broadly with us. The success of our competitors could result in our loss of market share and harm our business.
Our revenue may not continue to grow at its recent pace, or at all.
Our revenue may not continue to grow at the same pace as it has over the past several years. We believe that our future revenue growth will depend, among other factors, on our ability to:
| • | successfully expand and deepen our business and market share; |
20
| • | respond to seasonality and cyclicality in the real estate industry and the U.S. economy; |
| • | compete with the pricing and offerings of our competitors; |
| • | attract more customers to our website and mobile application; |
| • | successfully invest in developing technology, tools, features, and products; |
| • | maintain high levels of customer service; |
| • | maximize our lead agents’ productivity; |
| • | attract and retain high-quality lead agents; |
| • | successfully contract with high-quality partner agents; and |
| • | increase our brand awareness. |
We may not be successful in our efforts to do any of the foregoing, and any failure to be successful in these matters could adversely affect our revenue growth. You should not consider our past revenue growth to be indicative of our future growth.
If we’re not able to deliver a rewarding experience on mobile devices, whether through our mobile website or mobile application, we may be unable to attract and retain customers.
Developing and supporting a mobile website and mobile application across multiple operating systems and devices requires substantial time and resources. We may not be able to consistently provide a rewarding customer experience on mobile devices, and as a result customers we meet through our mobile website or mobile application may not choose to use our brokerage services, or those of our partner agents, at the same rate as customers we meet through our website.
As new mobile devices and mobile operating systems are released, we may encounter problems in developing or supporting our mobile website or mobile application for them. Developing or supporting our mobile website or mobile application for new devices and their operating systems may require substantial time and resources. The success of our mobile website and mobile application could also be harmed by factors outside our control, such as:
| • | increased costs to develop, distribute or maintain our mobile website or mobile application; |
| • | changes to the terms of service or requirements of a mobile application store that requires us to change our mobile application development or features in an adverse manner; and |
| • | changes in mobile operating systems, such as Apple’s iOS and Google’s Android, that disproportionately affect us, degrade the functionality of our mobile website or mobile application, require that we make costly upgrades to our offerings or give preferential treatment to competitive websites or mobile applications. |
Adverse developments in economic conditions could harm our business.
Our business is sensitive to general economic conditions that are outside of our control. These conditions include interest rates, inflation, fluctuations in consumer confidence, fluctuations in equity and debt capital markets, availability of credit, and the strength of financial institutions, which are
21
sensitive to changes in the general macroeconomic environment. A host of factors beyond our control could cause fluctuations in these conditions, including the political environment, disruptions in an economically significant geographic region, or equity or debt markets, acts or threats of war, or terrorism, any of which could harm our business.
Our growth may be limited due to historically low home inventory levels.
Traditionally, a “balanced” residential real estate industry requires enough homes on the market to satisfy six months of homebuyer demand. In recent years, home inventory has remained at historically low levels in many parts of the United States. Low inventory levels can harm our ability to attract customers, inflate home prices, increase competition for homes, increase our operating expenses because of home touring and offer-writing activities that do not result in closed home purchases, and reduce transaction volumes. As a result, our customers may be unable to complete a sufficient number of real estate transactions to sustain or grow our transaction volume and revenue.
We may not be able to attract, retain or effectively train, motivate and utilize lead agents.
As a result of our business model, our lead agents generally earn less on a per transaction basis than traditional agents, which may be unattractive to some agents. Because our model is uncommon in our industry, agents considering working for us may not understand our compensation model, or may not perceive it to be more attractive than the independent contractor, commission-driven compensation model used by most traditional brokerages. If we‘re unable to attract, retain or effectively train, motivate and utilize lead agents, we will be unable to grow our revenue and we may be required to significantly increase our lead agent compensation or other costs, which would harm our business.
We are, and expect in the future to become, subject to an increasing variety of federal and state laws and regulations, many of which are continuously evolving, which increases our compliance costs and could subject us to claims or otherwise harm our business.
We are currently subject to a variety of, and may in the future become subject to, additional, federal, state and local laws that are continuously changing, including laws related to: the real estate, brokerage, title and mortgage industries; mobile- and Internet-based businesses; and data security, privacy and consumer protection laws. For instance, we are subject to federal laws such as the Fair Housing Act of 1968, or FHA, and the Real Estate Settlement Procedures Act of 1974. These laws can be costly to comply with, require significant management attention, and could subject us to claims, government enforcement actions, civil and criminal liability or other remedies, including revocation of licenses and suspension of business operations.
In some cases, it is unclear as to how such laws and regulations affect us based on our business model that is unlike traditional brokerages, and the fact that those laws and regulations were created for traditional real estate brokerages. If we are unable to comply with and become liable for violations of these laws or regulations, or if unfavorable regulations or interpretations of existing regulations by courts or regulatory bodies are implemented, we could be directly harmed and forced to implement new measures to reduce our liability exposure. It could cause our operations in affected markets to become overly expensive, time consuming or even impossible. This may require us to expend significant time, capital, managerial and other resources to modify or discontinue certain operations, limiting our ability to execute our business strategies, deepen our presence in our existing markets or expand into new markets. In addition, any negative exposure or liability could harm our brand and reputation. Any costs incurred as a result of this potential liability could harm our business.
Further, due to the geographic scope of our operations and the nature of the services we provide, we may be required to obtain and maintain additional real estate brokerage, title insurance
22
agency and mortgage broker licenses in certain states where we operate. Additionally, if we enter new markets, we may be required to comply with new laws, regulations, and licensing requirements. As part of licensing requirements, we are typically required to designate individual licensees of record. We cannot assure you that we are, and will remain at all times, in full compliance with all real estate, title insurance, and mortgage licensing laws and regulations, and we may be subject to fines or penalties, including license revocation, for any non-compliance. If in the future a state agency were to determine that we are required to obtain additional licenses in that state in order to transact business, or if we lose an existing license or are otherwise found to be in violation of a law or regulation, our business operations in that state may be suspended until we obtain the license or otherwise remedy the compliance issue.
We are subject to certain risks related to litigation filed by or against us, and adverse results may harm our business and financial condition.
We are from time to time involved in, and may in the future be subject to, claims, suits, government investigations, and proceedings arising from our business. We cannot predict with certainty the cost of defense, the cost of prosecution, insurance coverage or the ultimate outcome of litigation and other proceedings filed by or against us, including remedies, damage awards and penalties. Regardless of outcome, any such claims or actions could require significant time, money, managerial and other resources, result in negative publicity, and harm our business and financial condition. Such litigation and other proceedings may relate to:
| • | violations of laws and regulations governing the residential brokerage, title or mortgage industries; |
| • | employment law claims, including claims regarding worker misclassification; |
| • | compliance with wage and hour regulations; |
| • | privacy, cybersecurity incidents and data breach claims; |
| • | intellectual property disputes; |
| • | consumer protection and fraud matters; |
| • | brokerage disputes such as the failure to disclose hidden property defects, as well as other claims associated with failure to meet our client legal obligations, or incomplete or inaccurate listings data; |
| • | claims that our agents or brokerage engage in discriminatory behavior in violation of the FHA; |
| • | liability based upon the conduct of individuals or entities outside of our control, such as independent contractor partner agents or independent contractor associate agents; |
| • | disputes relating to our commercial relationships with third parties; and |
| • | actions relating to claims alleging other violations of federal, state or local laws and regulations. |
In addition, class action lawsuits, such as the existing worker misclassification claims we face, can often be particularly vexatious litigation given the breadth of claims, the large potential damages claimed and the significant costs of defense. The risks of litigation become magnified and the costs of
23
settlement increase in class actions in which the courts grant partial or full certification of a large class. Also, insurance coverage may be unavailable for certain types of claims and even where available, insurance carriers may dispute coverage for various reasons, including the cost of defense. Further, such insurance may not be sufficient to cover the losses we incur.
Any failure to maintain, protect, and enhance our brand would hurt our ability to grow our business, particularly in markets where we have limited brand recognition.
Maintaining, protecting, and enhancing our brand is critical to growing our business, particularly in markets where we have limited brand recognition and compete with well-known traditional brokerages with longer histories and established community presence. This will partially depend upon our ability to continue to provide high-value, customer-oriented, and differentiated services, and we may not be able to do so effectively. Enhancing and maintaining the quality of our brand may require us to make substantial investments, such as in marketing and advertising, technology, and agent training. If we do not successfully build and maintain a strong brand, our business could be harmed. In addition, despite these investments, our brand could be damaged from other events that are or may be beyond our control, such as litigation and claims, our failure to comply with local laws and regulations, and illegal activity such as phishing scams or cybersecurity attacks targeted at us, our customers, or others.
In addition to our agents, we rely on a flexible network of licensed third-party associate agents to conduct customer home tours and field events, and their status as independent contractors is being challenged and may be challenged in the future.
We are currently defending three lawsuits, each of which includes class and/or representative claims, and may from time to time be subject to additional lawsuits or administrative proceedings, claiming that certain of our independent contractor associate agents should be classified as our employees rather than independent contractors. These lawsuits and proceedings typically seek substantial monetary damages (including claims for unpaid wages, overtime, unreimbursed business expenses, and other items), injunctive relief, or both. Adverse determinations in these matters could, among other things, require us to adopt certain changes in our business practices that are costly and time-consuming to implement, entitle our independent contractor associate agents to the benefit of wage and hour laws, and result in employment and withholding tax and benefit liabilities, as well as changes to the independent contractor status of our other non-employee service providers. Regardless of the validity of these claims or their outcome, we have incurred, and anticipate incurring in the future, significant costs and efforts to defend against or settle them. In addition, if legislative and regulatory authorities take actions that classify our independent contractor service providers as employees, we would incur liabilities under a variety of laws and regulations including tax, workers’ compensation, unemployment benefits, labor, employment, and tort, including for prior periods, as well as potential liability for employee benefits and tax withholdings.
We are subject to an array of employment-related laws and regulations and failure to comply with these obligations could harm our business.
Our relationship with our employees is subject to various tax, wage and hour, unemployment, workers’ compensation, right to organize, anti-discrimination, workplace safety, and other employment-related laws. Each state has its own unique wage and hour laws, which have been the subject of growing litigation nationwide. In addition, federal and state regulatory authorities have increasingly challenged the classification of workers as independent contractors rather than employees. Legislators have also proposed legislation to make it easier to reclassify independent contractors as employees, including legislation to increase recordkeeping requirements for employers of independent contractors, and to abolish safe harbors allowing certain individuals to be treated as independent contractors.
24
Federal agencies and each state have their own rules and tests for determining the classification of workers, as well as whether employees meet exemptions from minimum wages and overtime laws. These tests consider many factors that also vary from state to state and have evolved based on case law, regulations and legislative changes. They frequently involve factual analysis as well. We may face significant penalties and damages if we are found to be noncompliant with any of these laws and regulations.
Referring customers to our partner agents may harm our business.
We refer customers to third-party partner agents when we do not have a lead agent available due to high demand or geographic limitations. Our dependence on partner agents can be particularly heavy in certain new markets as we build our operations to scale in those markets. Our partner agents are independent licensed agents affiliated with other brokerages and we do not have any control over their actions. We may not be able to attract and retain quality partner agents, and they may not offer the high-quality customer service that we expect. If our partner agents were to provide diminished quality of customer service, engage in malfeasance or otherwise violate the law, MLS or other broker rules and regulations, our reputation and business may be harmed. Improper actions involving our partner agents may also lead to direct legal claims against us based on agency, vicarious or other theories of liability, which, if determined adversely, could increase our costs, affect the use of partner agents as part of our business model and subject us to liability for their actions, including revocation of our licenses and suspension of business operations. Our partner agents may also disagree with us and our strategies regarding the business or our interpretation of our respective rights and obligations under our partner relationships. This could lead to disputes with our partner agents. To the extent we have such disputes, the attention of our management and our partner agents will be diverted, which could harm our business.
Additionally, referring customers to partner agents limits our growth and brand awareness because referring customers to partner agents potentially redirects repeat and referral opportunities to them. Referring customers to partner agents may also dilute the effectiveness of our marketing efforts and may lead to customer confusion or dissatisfaction when they are offered the opportunity to work with a partner agent rather than one of our lead agents. Nevertheless, retaining more customers than we are able to serve may affect customer satisfaction by overloading our lead agents and teams. If we are unable to allocate transactions between our lead agents and partner agents efficiently, and successfully contract with high-quality partner agents, our business may be harmed.
If our technology and development efforts are not successful, our business may be harmed.
We intend to continue investing significant resources in developing technology, tools, features, and products. If we do not spend our development budget efficiently or effectively on commercially successful and innovative technologies, we may not realize the expected benefits of our strategy. Moreover, technology development is inherently challenging and expensive, and the nature of development cycles may result in delays between the time we incur expenses and the time we make available new offerings and generate revenue, if any, from those investments. Anticipated customer demand for an offering we are developing could also decrease after the development cycle has commenced, and we would not be able to recoup substantial costs we incurred. In addition, there are many competitors in the markets we serve, including brokerages as well as non-brokerage real estate websites, and we may not be able to effectively compete both as a brokerage and a developer, of technology. We cannot assure you that we will be able to identify, design, develop, implement and utilize, in a timely and cost-effective manner, technologies necessary for us to compete effectively, that such technologies will be commercially successful, or that products and services developed by others will not render our offerings noncompetitive or obsolete. If we do not achieve the desired or anticipated customer acquisition and transaction efficiency leverage from our technology investments, our business may be harmed.
25
Our introduction of new services could fail to produce the desired or predicted results or harm our brand or reputation.
From time to time, we introduce and implement new services. For instance, in early 2013, we began offering title and settlement services in limited markets. We have limited experience operating businesses outside of our core brokerage offerings and forecasting our revenue for any new service is inherently uncertain, and our actual results may vary significantly from what we desire or predict. Additionally, these new services may fail to attract customers, reduce customer confidence in our services, undermine our customer-first reputation, or result in disputes between our customers and us. Any such event could harm our brand and reputation.
New services that we introduce and implement, including our planned mortgage offering, may subject us to new laws and regulations.
From time to time, we may introduce and implement new services in highly regulated areas. For instance, our title and settlement services are subject to regulation by insurance and other regulatory authorities on the federal level and in each state in which we provide such services. Compliance with new and existing regulatory and compliance regimes is time consuming and may require significant time and effort, which may divert attention and resources from our other offerings.
We plan to originate mortgage loans to customers in a limited number of markets through our wholly owned subsidiary, Redfin Mortgage, LLC. Redfin Mortgage is subject to a wide array of stringent federal and state laws, regulations, and agency oversight. These include laws and regulations governing the relationship between us and Redfin Mortgage, the manner in which Redfin Mortgage will conduct its loan origination and servicing businesses, the fees that it may charge, procedures relating to real estate settlement, fair lending, fair credit reporting, truth in lending, loan officer licensing, property valuation, escrow, payment processing, collection, foreclosure, and federal and state disclosure and licensing requirements. In addition, Redfin Mortgage will receive, transmit and store personally identifiable information from our customers to process mortgage applications and transactions. The sharing, use, disclosure and protection of such information is governed by federal, state, and international laws regarding privacy and data security, and all of which are constantly evolving. Changes to or a failure to comply with these laws and regulations could limit Redfin Mortgage’s ability to originate and fund mortgage loans, require us to change our business practices, result in revocation or suspension of our licenses and subject us to significant civil and criminal penalties. Any such events could harm our business.
If our current or future technology developments and service improvements do not meet customer or agent expectations, our business may be harmed.
Our technology-powered brokerage model is relatively new and unproven, and differs significantly from traditional residential brokerages. Our success depends on our ability to innovate and adapt our technology-powered brokerage to meet evolving industry standards and customer and agent expectations. We have expended, and expect to continue to expend, substantial time, capital and other resources understanding the needs of customers and agents and developing technology and service offerings to meet those needs. We cannot assure you that our current and future offerings will be satisfactory to or broadly accepted by customers and agents, or competitive with the offerings of other businesses. If our current or future offerings are unable to meet industry and customer and agent expectations in a timely and cost-effective manner, our business will be harmed.
26
We could be required to cease certain activities or incur substantial costs as a result of any claim of infringement of another party’s intellectual property rights.
From time to time, we may receive claims from third parties, including our competitors, that our offerings or underlying technology infringe or violate that third party’s intellectual property rights. We may be unaware of the intellectual property rights of others that may cover some or all of our technology. If we are sued by a third party that claims our technology infringes on its rights, the litigation (with or without merit) could be expensive, time-consuming and distracting to management. The results of such disputes or litigation are difficult to predict. The results of any intellectual property litigation to which we might become a party may require us to do one or more of the following:
| • | cease offering or using technologies that incorporate the challenged intellectual property; |
| • | make substantial payments for judgments, legal fees, settlement payments, ongoing royalties or other costs or damages; |
| • | obtain a license, which may not be available on reasonable terms or at all, to use the relevant technology; or |
| • | redesign our technology to avoid infringement. |
If we are required to make substantial payments or undertake any of the other actions noted above as a result of any intellectual property infringement claims against us, such payments or costs could have an adverse effect upon our business and financial results. Even if we were to prevail, such claims and proceedings could harm our business.
Any failure to protect our intellectual property rights could impair our ability to protect our proprietary technology and our brand.
Our success and ability to compete depends in part upon our intellectual property. We primarily rely on a combination of patent, trademark, trade secret, and copyright laws, as well as confidentiality procedures and contractual restrictions with our employees, independent contractors and others to establish and protect our intellectual property rights. However, the steps we take to protect our intellectual property rights may be inadequate or we may be unable to secure intellectual property protection for all of our technology and methodologies.
If we are unable to protect our intellectual property, our competitors could use our intellectual property to market offerings similar to ours and our ability to compete effectively would be impaired. Moreover, others may independently develop technologies that are competitive to ours or infringe on our intellectual property. The enforcement of our intellectual property rights depends on our legal actions against these infringers being successful, but we cannot be sure these actions will be successful, even when our rights have been infringed. In addition, defending our intellectual property rights might entail significant expense and diversion of management resources. Any of our intellectual property rights may be challenged by others or invalidated through administrative processes or litigation. Furthermore, legal standards relating to the validity, enforceability and scope of protection of intellectual property rights are uncertain and constantly changing. Accordingly, despite our efforts, we may be unable to prevent third parties from infringing or misappropriating our intellectual property. Any intellectual property that we own may not provide us with competitive advantages or may be successfully challenged by third parties.
Our efforts to enforce our intellectual property rights may be met with defenses, counterclaims and countersuits attacking the validity and enforceability of our intellectual property rights. Litigation to
27
protect and enforce our intellectual property rights could be expensive, time-consuming and distracting to management, and could ultimately result in the impairment or loss of portions of our intellectual property.
We employ third-party licensed technology, and the inability to maintain these licenses or errors in the software we license could result in increased costs, or reduced service levels, which would harm our business.
Our technology employs certain third-party software obtained under licenses from other companies. We anticipate that we will continue to rely on such third-party software and tools in the future. Although we believe that there are commercially reasonable alternatives to the third-party software we currently license, this may not always be the case, or it may be difficult or costly to replace. In addition, integration of our technology with new third-party software may require significant work and require substantial investment of our time and resources. Also, to the extent that our technology depends upon the successful operation of third-party software, any undetected errors or defects in the third-party software could prevent the deployment or impair the functionality of our technology, delay new offerings, result in a failure of our website or mobile application, and harm our reputation. Our use of additional or alternative third-party software would require us to enter into license agreements with third parties, which may not be available on commercially reasonable terms, or at all.
Some aspects of our technology include open source software, and any failure to comply with the terms of one or more of these open source licenses could harm our business.
Our technology incorporates software covered by open source licenses. The terms of various open source licenses have not been interpreted by U.S. courts, and there is a risk that such licenses could be construed in a manner that imposes unanticipated conditions or restrictions on our technology. If portions of our proprietary software are determined to be subject to an open source license, we could be required to publicly release the affected portions of our source code, re-engineer all or a portion of our technologies or otherwise be limited in our use of such software, each of which could reduce or eliminate the value of our technologies and harm our business. In addition to risks related to license requirements, use of open source software can lead to greater risks than use of third-party commercial software, as open source licensors generally do not provide warranties or controls on the origin of the software. Many of the risks associated with use of open source software cannot be eliminated, and if such risks materialize, could harm our business.
Moreover, we cannot assure you that our processes for controlling our use of open source software will be effective. If we are held not to have complied with the terms of an applicable open source software license, we could be required to seek licenses from third parties to continue offering our services on terms that are not economically feasible, to re-engineer our technology to remove or replace the open source software, to discontinue the use of certain technology if re-engineering could not be accomplished on a timely basis, to pay monetary damages, to make generally available the source code for our proprietary technology, or to waive certain intellectual property rights, any of which could harm our business.
Responding to any infringement or other enforcement claim, regardless of its validity, could harm our business, operating results, and financial condition, by, among other things:
| • | resulting in time-consuming and costly litigation; |
| • | diverting management’s time and attention from developing our business; |
28
| • | requiring us to pay monetary damages or enter into royalty and licensing agreements that we would not normally find acceptable; |
| • | requiring us to redesign certain components of our software using alternative non-infringing source technology or practices, which could require significant effort and expense; |
| • | disrupting our customer relationships if we are forced to cease offering certain services; |
| • | requiring us to waive certain intellectual property rights associated with our release of open source software, or contributions to third-party open source projects; |
| • | requiring us to disclose our software source code; and |
| • | requiring us to satisfy indemnification obligations. |
Our business depends on third-party network and mobile infrastructure and on our ability to maintain and scale the technology underlying our offerings.
Our brand, reputation, and ability to attract homebuyers and home sellers and provide our offerings depend on the reliable performance of third-party network and mobile infrastructure. As the number of homebuyers and home sellers, agents, and listings shared on our website and mobile application and the extent and types of data grow, our need for additional network capacity and computing power will also grow. Operating our underlying technology systems is expensive and complex, and we could experience operational failures. If we experience interruptions or failures in these systems, whether due to system failures, computer viruses, physical or electronic break-ins, attacks on domain name servers or other third parties on which we rely, or any other reason, the security and availability of our services and technologies could be affected. Any such event could harm our reputation, result in a loss of consumers, customers and agents using our offerings and cause us to incur additional costs.
Our website is hosted at a single facility, the failure of which would harm our business.
Our website is hosted at a single facility in Seattle, Washington. We do not currently have a back-up web hosting facility in a different geographic area. Should this facility experience outages or downtimes for any reason, including a natural disaster or some other event, such as human error, fire, flood, power loss, telecommunications failure, physical or electronic break-ins, terrorist attacks, acts of war, and similar events, we could suffer a significant interruption of our website and mobile application, which would harm our business. In addition, our website and mobile application could be interrupted even if this facility experiences temporary outages, which could also negatively affect our services and harm our business.
Cybersecurity incidents could disrupt our business operations, result in the loss of critical and confidential information, and harm our business.
Global cybersecurity threats and incidents can range from uncoordinated individual attempts to gain unauthorized access to information technology systems to sophisticated and targeted measures known as advanced persistent threats, directed at us or our third-party service providers. In the ordinary course of our business, we and our third-party service providers collect and store sensitive data, including our proprietary business information and intellectual property, and that of our customers, including personally identifiable information. Additionally, we increasingly rely on third-party data storage providers. The secure processing, maintenance and transmission of this information are critical to our operations and we rely on the security procedures of these third-party data storage providers. Although we employ comprehensive measures designed to prevent, detect, address and
29
mitigate these threats (including access controls, data encryption, vulnerability assessments and maintenance of backup and protective systems), cybersecurity incidents, depending on their nature and scope, could potentially result in the misappropriation, destruction, corruption or unavailability of critical data and confidential or proprietary information (our own or that of third parties, including personally identifiable information of our customers) and the disruption of business operations. Any such compromises to our security could cause customers to lose trust and confidence in us, and stop using our website and mobile application in their entirety. In addition, we may incur significant costs for remediation that may include liability for stolen assets or information, repair of system damage, and compensation to customers and business partners. We may also be subject to legal claims, government investigation and additional state and federal statutory requirements.
Our software is highly complex and may contain undetected errors.
The software and systems underlying our technology and offerings are highly complex and may contain undetected errors or vulnerabilities, some of which may only be discovered after their implementation. Our development and testing processes may not be sufficient to ensure that we will not encounter technical problems. Any inefficiencies, errors, technical problems or vulnerabilities discovered in our software and systems after release could reduce the quality of our services or interfere with our agents’ and customers’ access to and use of our technology and offerings. This could result in damage to our reputation, loss of revenue or liability for damages, any of which could harm our business.
Changes in privacy or consumer protection laws could adversely affect our ability to attract customers and harm our business.
We collect information relating to our customers as part of our business and marketing activities. The collection and use of personal data is governed by privacy laws and regulations of the United States and other jurisdictions. Privacy regulations continue to evolve and, occasionally, may be inconsistent from one jurisdiction to another. Compliance with applicable privacy regulations may increase our operating costs or adversely impact our ability to market our services and products and serve our customers. In addition, non-compliance with applicable privacy regulations by us, or a breach of security systems storing our data may result in fines, payment of damages or restrictions on our use or transfer of data.
In addition, we are subject to, and may become subject to additional, laws or regulations which restrict or prohibit use of emails, similar marketing activities or other types of communication that we currently rely on. Such laws and regulations currently include the CAN-SPAM Act of 2003 and similar laws adopted by a number of states to regulate unsolicited commercial emails; the U.S. Federal Trade Commission, or the FTC, guidelines that impose responsibilities on companies with respect to communications with consumers; and the Telephone Consumer Protection Act which limits certain uses of automatic dialing systems, artificial or prerecorded voice messages and SMS text messages. Any further restrictions under such laws that govern our marketing activities could adversely affect the effectiveness of our marketing activities or other customer communications. Furthermore, even if we can comply with existing or new laws and regulations, we may discontinue certain activities or communications if we become concerned that our customers or potential customers deem them intrusive or they otherwise adversely affect our reputation. If our marketing activities are restricted, our ability to attract customers could be adversely affected and harm our business.
30
We rely on business data to make business decisions and drive our machine-learning technology, and errors or inaccuracies in such data may adversely affect our business decisions and the customer experience.
We regularly analyze business data to evaluate growth trends, measure our performance, establish budgets and make strategic decisions. Much of this data is internally generated and calculated and has not been independently verified. While our business decisions are based on what we believe to be reasonable calculations for the applicable period of measurement, there are inherent challenges in measuring and interpreting the data, and we cannot be sure that the data, or the calculations using such data, are accurate. Errors or inaccuracies in the data could result in poor business decisions, resource allocation or strategic initiatives. For instance, if we overestimate traffic to our website and mobile application, we may not invest an adequate amount of resources in attracting new customers or we may hire more lead agents in a given market than necessary to meet customer demand. If we make poor decisions based on erroneous or inaccurate data, our business may be harmed.
We use our business data and proprietary algorithms to inform our machine learning, such as in the calculation of our Redfin Estimate. If customers disagree with us or if our Redfin Estimate fails to accurately reflect market pricing such that we are unable to attract homebuyers or help our customers sell their homes at satisfactory prices, or at all, customers may lose confidence in us, and our brand and business may be harmed.
If we fail to effectively manage the growth of our operations, technology systems and infrastructure to service customers and agents, our business could be harmed.
We have experienced rapid and significant growth in recent years that has placed, and may continue to place, significant demands on our management and our operational and financial infrastructure. For example, we have grown from 752 employees as of December 31, 2013 to 1,845 employees as of December 31, 2016. As we continue to grow, our success will depend on our ability to expand, maintain and improve technology that supports our business operations, as well as our financial and management information systems, disclosure controls and procedures, internal controls over financial reporting, and to maintain effective cost controls. This requires us to commit substantial financial, operational and technical resources. Our ability to manage these efforts could be affected by many factors, including a lack of adequate staffing with the requisite expertise and training. If our operational technology is insufficient to reliably service our customers and agents, then the number of visitors to our website and mobile application could decrease, agents may not desire to work for us, our customer service and transaction volume could suffer, and our costs could increase. In addition, our reputation may be negatively affected. Any of these events could harm our business.
We depend on our senior management team to grow and operate our business, and if we are unable to hire, retain, manage, and motivate our key personnel, or if our new personnel do not perform as we anticipate, our business may be harmed.
Our future success depends upon our continued ability to identify, hire, develop, motivate, and retain qualified personnel, particularly those who have specialized skills and experience in technology fields and the residential brokerage industry. Further, we may not be able to retain the services of our key employees or other members of senior management in the future. In particular, we are highly dependent on Glenn Kelman, our Chief Executive Officer, who is critical to our business, consumer-focused mission, and strategic direction.
We do not have employment agreements other than offer letters with any employee, including our senior management team, and we do not maintain key person life insurance for any employee. Any
31
changes in our senior management team may be disruptive to our business. If we fail to retain or effectively replace members of our senior management team, or if our senior management team fails to work together effectively and to execute our plans and strategies, our business could be harmed.
Our growth strategy also depends on our ability to expand our organization by attracting and retaining high-quality personnel, particularly lead agents and experienced technical personnel. Identifying, recruiting, training, integrating, managing, and motivating talented individuals will require significant time, expense, and attention. Competition for talent is intense, particularly in many major markets we serve. In particular, hiring for technical personnel is highly competitive in Seattle and San Francisco, where substantially all of our technical team is located. If we are unable to effectively attract and retain qualified personnel, our business will be harmed.
Our dedication to our values and the customer experience may negatively influence our short-term financial results.
We have taken, and may continue to take, actions that we believe are in the best interests of customers and the long-term interests of the business, even if those actions do not necessarily maximize short-term financial results. For instance, we believe we could increase our profitability in the short term by engaging lead agents as independent contractors and compensating them on transaction value-based commissions, but instead we employ our lead agents and compensate them based in part on customer satisfaction. However, this approach may not result in the long-term benefits that we expect, in which case our business and results of operations could be harmed.
We may need to raise additional capital to grow our business, and we may not be able to raise it on terms acceptable to us, or at all.
Growing and operating our business will require significant cash outlays and capital expenditures and commitments to respond to business challenges, including developing or enhancing new or existing services and technologies, and expanding our operating infrastructure. If cash on hand, cash generated from operations and the net proceeds from this offering are not sufficient to meet our cash requirements, we may need to seek additional capital, potentially through debt or equity financings. We may not be able to raise needed cash on terms acceptable to us, or at all. Such financings may be on terms that are dilutive or potentially dilutive to our stockholders, and the prices at which new investors would be willing to purchase our securities may be lower than the initial public offering price of this offering or the then-current market price per share of our common stock. The holders of new securities may also have rights, preferences or privileges which are senior to those of existing stockholders. If new financing sources are required, but are insufficient or unavailable, we may need to modify our growth and operating plans and business strategies based on available funding, if any, which would harm our ability to grow our business.
We intend to evaluate acquisitions or investments in third-party technologies and businesses, but we may not realize the anticipated benefits from, and may have to pay substantial costs related to, any acquisitions, mergers, joint ventures, or investments that we undertake.
As part of our business strategy, we evaluate acquisitions of, or investments in, a wide array of potential strategic opportunities, including third-party technologies and businesses. We may be unable to identify suitable acquisition candidates in the future or to make these acquisitions on a commercially reasonable basis, if at all. Any transactions that we enter into could be material to our financial condition and results of operations. Such acquisitions may not result in the intended benefits to our business, and we may not successfully evaluate or utilize the acquired technology, offerings, or
32
personnel, or accurately forecast the financial effect of an acquisition transaction. The process of integrating an acquired company, business, technology or personnel into our own company is subject to various risks and challenges, including:
| • | diverting management time and focus from operating our business to acquisition integration; |
| • | disrupting our respective ongoing businesses; |
| • | customer and industry acceptance of the acquired company’s offerings; |
| • | our ability to implement or remediate the controls, procedures and policies of the acquired company; |
| • | retaining and integrating acquired employees; |
| • | failing to maintain important business relationships and contracts; |
| • | liability for activities of the acquired company before the acquisition; |
| • | litigation or other claims arising in connection with the acquired company; |
| • | impairment charges associated with goodwill and other acquired intangible assets; and |
| • | other unforeseen operating difficulties and expenditures. |
Our failure to address these risks or other problems we encounter with our future acquisitions and investments could cause us to not realize the anticipated benefits of such acquisitions or investments, incur unanticipated liabilities, and harm our business.
We will incur increased costs as a result of operating as a public company and our management will be required to devote substantial time to new compliance initiatives.
As a public company, particularly after we are no longer an emerging growth company, we will incur significant legal, accounting and other expenses that we did not incur as a private company. In addition, the Sarbanes-Oxley Act of 2002, or the Sarbanes-Oxley Act, and rules subsequently implemented by the U.S. Securities and Exchange Commission, or SEC, and , have imposed various requirements on public companies, including establishment and maintenance of effective disclosure and financial controls and corporate governance practices. Our management and other personnel have limited experience operating a public company, which may result in operational inefficiencies or errors, or a failure to improve or maintain effective internal control over financial reporting and disclosure controls and procedures necessary to ensure timely and accurate reporting of operational and financial results. We may need to hire additional personnel, and our existing management team will need to devote a substantial amount of time to these compliance initiatives. Moreover, these rules and regulations will increase our legal and financial compliance costs and will make some activities more time-consuming and costly.
Pursuant to Section 404 of the Sarbanes-Oxley Act, we will be required to furnish a report by our management on our internal control over financial reporting, including an attestation report on internal control over financial reporting issued by our independent registered public accounting firm. However, while we remain an emerging growth company, we will not be required to include an
33
attestation report on internal control over financial reporting issued by our independent registered public accounting firm. To achieve compliance with Section 404 within the prescribed period, we will be engaged in a process to document and evaluate our internal control over financial reporting, which is both costly and challenging. In this regard, we will need to continue to dedicate internal resources, potentially engage outside consultants and adopt a detailed work plan to assess and document the adequacy of internal control over financial reporting, continue steps to improve control processes as appropriate, validate through testing that controls are functioning as documented and implement a continuous reporting and improvement process for internal control over financial reporting. Despite our efforts, there is a risk that neither we nor our independent registered public accounting firm will be able to conclude within the prescribed timeframe that our internal control over financial reporting is effective as required by Section 404. This could result in an adverse reaction in the financial markets due to a loss of confidence in the reliability of our consolidated financial statements.
In addition, changing laws, regulations and standards relating to corporate governance and public disclosure are creating uncertainty for public companies, increasing legal and financial compliance costs and making some activities more time consuming. These laws, regulations and standards are subject to varying interpretations, in many cases due to their lack of specificity and, as a result, their application in practice may evolve over time as new guidance is provided by regulatory and governing bodies. This could result in continuing uncertainty regarding compliance matters and higher costs necessitated by ongoing revisions to disclosure and governance practices. We intend to invest resources to comply with evolving laws, regulations and standards, and this investment may result in increased general and administrative expenses and a diversion of management’s time and attention from revenue-generating activities to compliance activities. If our efforts to comply with new laws, regulations and standards differ from the activities intended by regulatory or governing bodies due to ambiguities related to their application and practice, regulatory authorities may initiate legal proceedings against us and our business may be harmed.
We also expect that being a public company and compliance with applicable rules and regulations will make it more expensive for us to obtain director and officer liability insurance, and we may be required to incur substantially higher costs to obtain and maintain the same or similar coverage. These factors could also make it more difficult for us to attract and retain qualified executive officers and members of our board of directors.
Our ability to use net operating losses to offset future taxable income may be limited.
As of December 31, 2015, we had federal net operating loss carryforwards, or NOLs, we may use to reduce future taxable income or offset income taxes due. The NOLs start expiring in 2025. Insufficient future taxable income will adversely affect our ability to deploy these NOLs and credit carryforwards. In addition, under Section 382 of the U.S. Internal Revenue Code of 1986, as amended, or the Code, a corporation that experiences a more-than 50% ownership change over a three-year testing period is limited in its ability to use its pre-change NOLs and other tax assets to offset future taxable income or income taxes due. Our existing NOLs and credit carryforwards may be subject to limitations arising from previous ownership changes; if we undergo an ownership change in connection with or after this offering, then our ability to use our NOLs and credit carryforwards could be further limited by Section 382 of the Code. Future changes in our stock ownership, the causes of which may be outside our control, could result in an ownership change under Section 382 of the Code. Our NOLs may also be impaired under state law. As a result of these limitations, we may not be able to utilize a material portion of, or possibly any of, the NOLs and credit carryforwards.
34
Catastrophic events may disrupt our business.
Natural disasters or other catastrophic events may damage or disrupt our operations, local and regional real estate markets, or the U.S. economy, and thus could harm our business. Our headquarters is located in Seattle, Washington, an earthquake-prone area. A natural disaster or catastrophic event in Seattle could interrupt our engineering and financial functions and impair access to internal systems, documents and equipment critical to the operation of our business. Many of the major markets we serve, such as the San Francisco Bay Area and Southern California, are also located in earthquake zones and are susceptible to natural disasters. Additionally, other significant natural disasters or catastrophic events in any of the major markets we serve could harm our business.
As we grow, the need for business continuity planning and disaster recovery plans will become increasingly important. If we are unable to develop adequate plans to ensure that our business functions continue to operate during and after a disaster, and successfully execute on those plans in the event of a disaster or emergency, our business would be harmed.
We could be subject to significant losses if banks do not honor our escrow and trust deposits.
Through Title Forward, our title and settlement services business, we act as an escrow agent for numerous customers. As an escrow agent, we receive money from customers to hold until certain conditions are satisfied. These funds are held as restricted cash on our balance sheet; because we do not have rights to the cash, a corresponding customer deposit liability in the same amount is recognized in our consolidated balance sheets in other payables. Upon the satisfaction of the applicable conditions, we release the money to the appropriate party. Although we deposit this money with various banks, we remain contingently liable for the disposition of these deposits. The banks may hold a significant amount of these deposits in excess of the federal deposit insurance limit. If any of our depository banks were to become unable to honor any portion of our deposits, customers could seek to hold us responsible for such amounts and, if the customers prevailed in their claims, we could be subject to significant losses.
Risks Relating to this Offering and Ownership of Our Common Stock
There has been no prior public market for our common stock, the stock price of our common stock may be volatile or may decline regardless of our performance, and you may not be able to resell your shares at or above the initial public offering price.
There has been no public market for our common stock prior to this offering. The initial public offering price for our common stock will be determined through negotiations among the underwriters and us, and may vary from the market price of our common stock following this offering. The market prices of the securities of newly public companies have historically been highly volatile. The market price of our common stock may fluctuate significantly in response to numerous factors, many of which are beyond our control, including:
| • | overall performance of the equity markets and the performance of technology or real estate companies, in particular; |
| • | variations in our results of operations, cash flows, and other financial metrics and non-financial metrics, and how those results compare to analyst expectations; |
| • | changes in the financial projections we may provide to the public or our failure to meet those projections; |
35
| • | failure of securities analysts to initiate or maintain coverage of us, changes in financial estimates by any securities analysts who follow our company, or our failure to meet these estimates or the expectations of investors; |
| • | recruitment or departure of key personnel; |
| • | variations in general market, financial markets, economic and political conditions in the United States; |
| • | changes in mortgage interest rates; |
| • | variations in the housing market, including seasonal trends and fluctuations; |
| • | negative publicity related to the real or perceived quality of our website and mobile application, as well as the failure to timely launch new products and services that gain market acceptance; |
| • | rumors and market speculation involving us or other companies in our industry; |
| • | announcements by us or our competitors of significant technical innovations, new business models or changes in pricing; |
| • | acquisitions, strategic partnerships, joint ventures, or capital commitments; |
| • | new laws, regulations or executive orders or new interpretations of existing laws or regulations applicable to our business; |
| • | changes in MLS or other broker rules and regulations or new interpretations of rules and regulations applicable to our business; |
| • | lawsuits threatened or filed against us, or unfavorable determinations or settlements in any such suits; |
| • | developments or disputes concerning our intellectual property or our technology, or third-party proprietary rights; |
| • | changes in accounting standards, policies, guidelines, interpretations, or principles; |
| • | other events or factors, including those resulting from war, incidents of terrorism, or responses to these events; |
| • | the expiration of contractual lock-up or market standoff agreements; and |
| • | sales of shares of our common stock by us or our stockholders. |
In addition, the stock markets have experienced extreme price and volume fluctuations that have affected and continue to affect the market prices of equity securities of many companies. Stock prices of many companies, and technology companies in particular, have fluctuated in a manner unrelated or disproportionate to the operating performance of those companies. In the past, stockholders have instituted securities class action litigation following periods of market volatility. If we were to become involved in securities litigation, it could subject us to substantial costs, divert resources and the attention of management from our business, and harm our business.
36
If securities or industry analysts do not publish research or publish inaccurate or unfavorable research about our business, our stock price and trading volume could decline.
The trading market for our common stock will depend in part on the research and reports that securities or industry analysts publish about us or our business, our market and our competitors. We do not have any control over these analysts. If one or more of the analysts who cover us downgrade our shares or change their opinion of our shares, our share price would likely decline. If one or more of these analysts cease coverage of us or fail to regularly publish reports on us, we could lose visibility in the financial markets, which could cause our share price or trading volume to decline.
Because the initial public offering price of our common stock will be substantially higher than the pro forma net tangible book value per share of our outstanding common stock following this offering, new investors will experience immediate and substantial dilution.
The initial public offering price is substantially higher than the pro forma net tangible book value per share of our common stock immediately following this offering based on the total value of our tangible assets less our total liabilities. Therefore, if you purchase shares of our common stock in this offering, based on the midpoint of the price range set forth on the cover page of this prospectus, and the issuance of shares of common stock in this offering, you will experience immediate dilution of $ per share, the difference between the price per share you pay for our common stock and its pro forma net tangible book value per share as of September 30, 2016. Furthermore, if the underwriters exercise their option to purchase additional shares, if outstanding stock options are exercised, if we issue awards to our employees under our equity incentive plans, or if we otherwise issue additional shares of our common stock, you could experience further dilution. See “Dilution” for additional information.
Sales of a substantial number of shares of our common stock may cause the price of our common stock to decline.
Based on shares outstanding as of , 2017, upon completion of this offering, we will have outstanding a total of shares of common stock. Of these shares, only the shares of common stock sold in this offering, or shares if the underwriters exercise their option to purchase additional shares in full, will be freely tradable, without restriction, in the public market immediately after the offering. Each of our officers, directors and substantially all of our securityholders, have entered into lock-up agreements with the underwriters that restrict their ability to sell or transfer their shares. The lock-up agreements pertaining to this offering will expire 180 days from the date of this prospectus. However, our underwriters may, in their sole discretion, permit our officers, directors and other current stockholders who are subject to the contractual lock-up to sell shares prior to the expiration of the lock-up agreements. After the lock-up agreements expire, based on shares outstanding as of , 2017, up to an additional shares of common stock will be eligible for sale in the public market, approximately of which are held by our officers, directors and their affiliated entities, and will be subject to volume limitations under Rule 144 under the Securities Act of 1933, as amended, or the Securities Act, and various vesting agreements. In addition, shares of our common stock that are subject to outstanding options as of , 2017 and shares of our common stock that are subject to options granted after , 2017 will become eligible for sale in the public market to the extent permitted by the provisions of various vesting agreements, the lock-up agreements and Rules 144 and 701 under the Securities Act.
After this offering, the holders of an aggregate of shares of our outstanding common stock as of , 2017 will have rights, subject to some conditions, to require us to file registration statements covering their shares or to include their shares in registration statements that we may file for ourselves or our stockholders. We also intend to register shares of common stock that we may
37
issue under our equity incentive plans. Once we register these shares, they will be able to be sold freely in the public market upon issuance, subject to the 180-day lock-up period under the lock-up agreements described above and below in “Underwriting.”
We cannot predict what effect, if any, sales of our shares in the public market or the availability of shares for sale will have on the market price of our common stock. However, future sales of substantial amounts of our common stock in the public market, including shares issued upon exercise of outstanding options, or the perception that such sales may occur, could adversely affect the market price of our common stock.
We also expect that significant additional capital may be needed in the future to continue our planned operations. To raise capital, we may sell common stock, convertible securities or other equity securities in one or more transactions at prices and in a manner we determine from time to time. These sales, or the perception in the market that the holders of a large number of shares intend to sell shares, could reduce the market price of our common stock.
We will have broad discretion in the use of the net proceeds from this offering and may not use them effectively.
Our management will have broad discretion in the application of the net proceeds from this offering, including for any of the purposes described below in “Use of Proceeds,” and you will not have the opportunity as part of your investment decision to assess whether the net proceeds are being used appropriately. Because of the number and variability of factors that will determine our use of the net proceeds from this offering, their ultimate use may vary substantially from their currently intended use. If we do not use the net proceeds that we receive in this offering effectively, our business, financial condition, results of operations, and prospects could be harmed, and the market price of our common stock could decline. Pending their use, we may invest the net proceeds from this offering in short-term, investment-grade, interest-bearing securities such as money market accounts, certificates of deposit, commercial paper, and guaranteed obligations of the U.S. government that may not generate a high yield to our stockholders.
We do not intend to pay dividends for the foreseeable future.
We have never declared or paid any cash dividends on our common stock and do not intend to pay any cash dividends in the foreseeable future. We currently anticipate that for the foreseeable future we will retain all of our future earnings for the development, operation and expansion of our business and for general corporate purposes. Any determination to pay dividends in the future will be at the discretion of our board of directors. Accordingly, investors must rely on sales of their common stock after price appreciation, which may never occur, as the only way to realize any future gains on their investments.
Our executive officers, directors, principal stockholders and their affiliates will continue to exercise significant influence over our company after this offering, which will limit your ability to influence corporate matters and could delay or prevent a change in corporate control.
As of , 2017, our executive officers, directors, five percent or greater stockholders and their respective affiliates owned in the aggregate approximately % of our capital stock and, upon completion of this offering, that same group will hold in the aggregate approximately % of our outstanding voting stock (assuming no exercise of the underwriters’ option to purchase additional shares, no exercise of outstanding options and no purchases of shares in this offering by any members of this group), in each case assuming the conversion of all outstanding shares of our redeemable
38
convertible preferred stock into shares of our common stock immediately prior to the closing of this offering.
As a result, after this offering these stockholders will continue to have the ability to influence us through this ownership position even if they do not purchase any additional shares in this offering. These stockholders may be able to determine all matters requiring stockholder approval. For example, these stockholders may be able to control elections of directors, amendments of our organizational documents, or approval of any merger, sale of assets, or other major corporate transaction. This may prevent or discourage unsolicited acquisition proposals or offers for our common stock that you may feel are in your best interest as one of our stockholders. The interests of this group of stockholders may not always coincide with your interests or the interests of other stockholders and they may act in a manner that advances their best interests and not necessarily those of other stockholders, including seeking a premium value for their common stock, and might affect the prevailing market price for our common stock.
We are an emerging growth company, and intend to take advantage of reduced disclosure requirements applicable to emerging growth companies, which could make our common stock less attractive to investors.
We are an emerging growth company, as defined in the Jumpstart Our Business Startups Act of 2012, or JOBS Act. We will remain an emerging growth company until the earliest of (1) the last day of the fiscal year in which we have total annual gross revenue of $1 billion or more; (2) the last day of the fiscal year following the fifth anniversary of the date of the completion of this offering; (3) the date on which we have issued more than $1 billion in nonconvertible debt during the previous three years; or (4) the date on which we are deemed to be a large accelerated filer under the rules of the SEC, which means the market value of our common stock that is held by non-affiliates exceeds $700 million as of the last business day of our most recently completed second fiscal quarter. For so long as we remain an emerging growth company, we are permitted and intend to rely on exemptions from certain disclosure requirements that are applicable to other public companies that are not emerging growth companies. These exemptions include:
| • | not being required to comply with the auditor attestation requirements of Section 404 of the Sarbanes-Oxley Act; |
| • | not being required to comply with any requirement that may be adopted by the Public Company Accounting Oversight Board regarding mandatory audit firm rotation or a supplement to the auditor’s report providing additional information about the audit and the financial statements; |
| • | being permitted to present only two years of audited financial statements in addition to any required unaudited interim financial statements with correspondingly reduced “Management’s Discussion and Analysis of Financial Condition and Results of Operations” disclosure in this prospectus; |
| • | reduced disclosure obligations regarding executive compensation; and |
| • | exemptions from the requirements of holding a nonbinding advisory vote on executive compensation and stockholder approval of any golden parachute payments not previously approved. |
We may choose to take advantage of some, but not all, of the available exemptions described above. We have taken advantage of reduced reporting burdens in this prospectus. In particular, we
39
have provided only two years of audited financial statements and have not included all of the executive compensation information that would be required if we were not an emerging growth company. We cannot predict whether investors will find our common stock less attractive if we rely on these exemptions. If some investors find our common stock less attractive as a result, there may be a less active trading market for our common stock and our stock price may be more volatile.
In addition, the JOBS Act provides that an emerging growth company can take advantage of an extended transition period for complying with new or revised accounting standards. This allows an emerging growth company to delay the adoption of certain accounting standards until those standards would otherwise apply to private companies. We have irrevocably elected not to avail ourselves of this exemption from new or revised accounting standards and, therefore, we will be subject to the same new or revised accounting standards as other public companies that are not emerging growth companies.
Provisions in our corporate charter documents and under Delaware or Washington law could make an acquisition of us, which may be beneficial to our stockholders, more difficult and may prevent attempts by our stockholders to replace or remove our current management.
Provisions in our restated certificate of incorporation and our restated bylaws that will become effective immediately prior to the completion of this offering may discourage, delay or prevent a merger, acquisition or other change in control of our company that stockholders may consider favorable, including transactions in which you might otherwise receive a premium for your shares. These provisions could also limit the price that investors might be willing to pay in the future for shares of our common stock, thereby depressing the market price of our common stock. In addition, because our board of directors is responsible for appointing the members of our management team, these provisions may frustrate or prevent any attempts by our stockholders to replace or remove our current management by making it more difficult for stockholders to replace members of our board of directors. Among other things, these provisions:
| • | establish a classified board of directors so that not all members of our board are elected at one time; |
| • | permit only the board of directors to establish the number of directors and fill vacancies on the board; |
| • | provide that directors may only be removed “for cause” and only with the approval of two-thirds of our stockholders; |
| • | require super-majority voting to amend some provisions in our restated certificate of incorporation and restated bylaws; |
| • | authorize the issuance of “blank check” preferred stock that our board could use to implement a stockholder rights plan, also known as a “poison pill”; |
| • | eliminate the ability of our stockholders to call special meetings of stockholders; |
| • | prohibit stockholder action by written consent, which requires all stockholder actions to be taken at a meeting of our stockholders; |
| • | prohibit cumulative voting; and |
40
| • | establish advance notice requirements for nominations for election to our board or for proposing matters that can be acted upon by stockholders at annual stockholder meetings. |
Moreover, we are governed by the provisions of Section 203 of the Delaware General Corporation Law, or DGCL, which prohibits a person who owns in excess of 15% of our outstanding voting stock from merging or combining with us for a period of three years after the date of the transaction in which the person acquired in excess of 15% of our outstanding voting stock, unless the merger or combination is approved in a prescribed manner. Likewise, because our principal executive offices are located in Washington, the anti-takeover provisions of the Washington Business Corporation Act may apply to us under certain circumstances now or in the future. These provisions prohibit a “target corporation” from engaging in any of a broad range of business combinations with any stockholder constituting an “acquiring person” for a period of five years following the date on which the stockholder became an “acquiring person.”
Any of these provisions of our charter documents or Delaware or Washington law could, under certain circumstances, depress the market price of our common stock. See “Description of Capital Stock.”
Our restated certificate of incorporation will designate the Court of Chancery of the State of Delaware as the sole and exclusive forum for certain types of actions and proceedings that may be initiated by our stockholders, which could limit our stockholders’ ability to obtain a favorable judicial forum for disputes with us or our directors, officers, employees or agents.
Our restated certificate of incorporation that will become effective immediately prior to the completion of this offering will provide that, unless we consent in writing to an alternative forum, the Court of Chancery of the State of Delaware, or the Court of Chancery, will be the sole and exclusive forum for any derivative action or proceeding brought on our behalf, any action asserting a claim of breach of a fiduciary duty owed by any of our directors, officers, employees or agents to us or our stockholders, any action asserting a claim arising pursuant to any provision of the DGCL, our restated certificate of incorporation or our restated bylaws or any action asserting a claim that is governed by the internal affairs doctrine, in each case subject to the Court of Chancery having personal jurisdiction over the indispensable parties named as defendants therein and the claim not being one which is vested in the exclusive jurisdiction of a court or forum other than the Court of Chancery or for which the Court of Chancery does not have subject matter jurisdiction. Any person purchasing or otherwise acquiring any interest in any shares of our capital stock shall be deemed to have notice of and to have consented to this provision of our restated certificate of incorporation.
This choice of forum provision may limit our stockholders’ ability to bring a claim in a judicial forum that it finds favorable for disputes with us or our directors, officers, employees or agents, which may discourage such lawsuits against us and our directors, officers, employees and agents even though an action, if successful, might benefit our stockholders. Stockholders who do bring a claim in the Court of Chancery could face additional litigation costs in pursuing any such claim, particularly if they do not reside in or near Delaware. The Court of Chancery may also reach different judgments or results than would other courts, including courts where a stockholder considering an action may be located or would otherwise choose to bring the action, and such judgments or results may be more favorable to us than to our stockholders. Alternatively, if a court were to find this provision of our restated certificate of incorporation inapplicable to, or unenforceable in respect of, one or more of the specified types of actions or proceedings, we may incur additional costs associated with resolving such matters in other jurisdictions, which could have an adverse effect on our business, financial condition or results of operations.
41
SPECIAL NOTE REGARDING FORWARD-LOOKING STATEMENTS
This prospectus contains forward-looking statements. All statements contained in this prospectus other than statements of historical fact, including statements regarding our future operating results and financial position, our business strategy and plans, market growth and trends, and our objectives for future operations, are forward-looking statements. The words “believe,” “may,” “will,” “estimate,” “continue,” “anticipate,” “intend,” “expect,” “could,” “would,” “project,” “plan,” “potentially,” “likely” and similar expressions are intended to identify forward-looking statements. We have based these forward-looking statements largely on our current expectations and projections about future events and trends that we believe may affect our financial condition, operating results, business strategy, short-term and long-term business operations and objectives, and financial needs. These forward-looking statements are subject to a number of risks, uncertainties, and assumptions, including those described under “Risk Factors.” Moreover, we operate in a very competitive and rapidly-changing environment. New risks emerge from time to time. It is not possible for our management to predict all risks, nor can we assess the effect of all factors on our business or the extent to which any factor, or combination of factors, may cause actual results to differ materially from those contained in any forward-looking statements we may make. In light of these risks, uncertainties, and assumptions, the future events and trends discussed in this prospectus may not occur and actual results could differ materially and adversely from those anticipated or implied in the forward-looking statements.
You should not rely upon forward-looking statements as predictions of future events. The events and circumstances reflected in the forward-looking statements may not be achieved or occur. Although we believe that the expectations reflected in the forward-looking statements are reasonable, we cannot guarantee that the future results, performance, or events and circumstances reflected in the forward-looking statements will be achieved or occur. We undertake no obligation to update any of these forward-looking statements for any reason after the date of this prospectus or to conform these statements to actual results or revised expectations.
You should read this prospectus and the documents that we reference in this prospectus and have filed with the SEC as exhibits to the registration statement of which this prospectus is a part with the understanding that our actual future results, performance, and events and circumstances may be materially different from what we expect.
42
INDUSTRY AND MARKET DATA AND CALCULATION OF KEY BUSINESS METRICS
Industry and Market Data
This prospectus includes data, forecasts, and information obtained from independent trade associations, industry publications, government agencies, surveys conducted by third parties and commissioned by or conducted by us, and other information available to us. The National Association of REALTORS®, or NAR, is the primary source for third-party industry data. In addition, we have used third-party industry data from the National Association of Home Builders, the National Bureau of Economic Research, the U.S. Census Bureau and certain other sources, as well as general economic data from the U.S. Department of Labor. While we believe that the industry data presented herein is derived from the most widely recognized sources for reporting U.S. residential real estate market statistical data, we do not endorse or suggest reliance on this data alone.
Certain information included in this prospectus concerning our industry and the markets we serve, including our market share, are also based on our good faith estimates derived from management’s knowledge of the industry and other information currently available to us. We regularly conduct or commission studies of homebuyers and home sellers, and have also used providers that provide panels to take third-party surveys that we design. We believe these internal company surveys and estimates are reliable, but such information involves a number of assumptions and limitations, and no independent sources have verified such surveys and estimates.
Industry publications, surveys and forecasts generally state that the information contained therein has been obtained from sources believed to be reliable, but such information may not be accurate or complete. We have not independently verified any of the data from third-party sources nor have we ascertained the underlying economic assumptions relied upon therein.
While we are not aware of any misstatements regarding the industry, survey or research data provided herein, our estimates involve risks and uncertainties and are subject to change based upon various factors, including those discussed under “Risk Factors” and “Special Note Regarding Forward-Looking Statements.”
Calculation of Key Business Metrics
Monthly Average Visitors
When we refer to “monthly average visitors” for a particular period, we are referring to the average number of unique visitors to our website and mobile application for each of the months in that period, as measured by Google Analytics, a product that provides digital marketing intelligence. Visitors are tracked by Google Analytics using cookies, with a unique cookie being assigned to each browser or mobile application on a device. For any given month, we count all of the unique cookies that visited our website or either our iOS or Android mobile applications during that month; each such unique cookie is a unique visitor. If a person accesses our website using different web browsers within a given month, each web browser has a unique cookie that is counted by Google Analytics as a separate visitor for that month. If a person accesses our mobile applications using different devices within a given month, each such mobile device is counted as a separate visitor for that month. If the same person accesses our website using an anonymous browser, or clears or resets cookies on their device, each access with a new cookie is counted as a new unique visitor for that month. If more than one person accesses our website from the same browser or our mobile application from the same device, this is counted as one unique visitor for that month.
43
Real Estate Transactions
We include a single transaction twice when we or our partner agents serve both the homebuyer and home seller of a transaction.
Real Estate Revenue per Real Estate Transaction
We calculate real estate revenue per real estate transaction by dividing brokerage, partner, or aggregate revenue, as applicable, by the corresponding number of real estate transactions in any period.
Aggregate Home Value of Real Estate Transactions
We include the value of a single transaction twice when we or our partner agents serve both the homebuyer and home seller of a transaction.
U.S. Market Share by Value
We calculate the aggregate value of U.S. home sales by multiplying the total number of U.S. home sales by the mean sale price of these sales, each as reported by NAR. We calculate our market share by aggregating the home value of real estate transactions conducted by our lead agents or our partner agents. Then, in order to account for both the sell- and buy-side components of each transaction, we divide that value by two-times the estimated aggregate value of U.S. home sales.
Average Number of Lead Agents
We calculate the average number of lead agents by taking the average of the number of lead agents at the end of each month included in the period.
44
We estimate that the net proceeds from the sale of shares of common stock in this offering will be approximately $ million, based on an assumed initial public offering price of $ per share, which is the midpoint of the price range set forth on the cover page of this prospectus, and after deducting the estimated underwriting discount and estimated offering expenses. If the underwriters exercise their option to purchase additional shares of our common stock in full, we estimate that our net proceeds would be approximately $ million, after deducting the estimated underwriting discount and estimated offering expenses.
A $1.00 increase (decrease) in the assumed initial public offering price of $ per share would increase (decrease) the net proceeds that we receive from this offering by approximately $ million, assuming that the number of shares of common stock offered by us, as set forth on the cover page of this prospectus, remains the same and after deducting the estimated underwriting discount. Each increase (decrease) of one million shares in the number of shares offered by us would increase (decrease) the net proceeds that we receive from this offering by approximately $ million, assuming that the assumed initial public offering price remains the same, and after deducting the estimated underwriting discount.
The principal purposes of this offering are to increase our capitalization and financial flexibility, create a public market for our common stock, and provide access to the public equity markets for us and our stockholders. We intend to use the net proceeds that we receive from this offering for working capital and other general corporate purposes, including technology and development and marketing activities, general and administrative matters, and capital expenditures. We may also use a portion of the net proceeds to invest in or acquire third-party businesses, products, services, technologies, or other assets. However, we do not currently have any definitive or preliminary plans with respect to the use of proceeds for such purposes.
We currently have no specific plans for the use of the net proceeds that we receive from this offering. Accordingly, we will have broad discretion in using these proceeds, and investors will be relying on the judgment of our management regarding the application of the proceeds. Pending their use as described above, we plan to invest the net proceeds in short-term, interest-bearing obligations, investment-grade instruments, certificates of deposit, or direct or guaranteed obligations of the U.S. government.
45
We have never declared or paid cash dividends on our capital stock. We do not expect to pay dividends on our capital stock for the foreseeable future. Instead, we anticipate that all of our earnings for the foreseeable future will be used for the operation and growth of our business. Any future determination to declare cash dividends would be subject to the discretion of our board of directors and would depend upon various factors, including our operating results, financial condition, and capital requirements, restrictions that may be imposed by applicable law, and other factors deemed relevant by our board of directors.
46
The following table sets forth our cash, cash equivalents and short-term investments and capitalization as of September 30, 2016 on:
| • | an actual basis; |
| • | a pro forma basis to give effect to (1) the automatic conversion of all shares of our redeemable convertible preferred stock outstanding as of September 30, 2016 into 166,266,114 shares of our common stock, and (2) the filing and effectiveness of our restated certificate of incorporation; and |
| • | a pro forma as adjusted basis to give effect to the adjustments described above and the sale of shares of our common stock in this offering at an assumed initial public offering price of $ per share, which is the midpoint of the price range set forth on the cover page of this prospectus, after deducting the estimated underwriting discount and estimated offering expenses. |
You should read this table together with our consolidated financial statements and related notes, “Selected Consolidated Financial Data,” and “Management’s Discussion and Analysis of Financial Condition and Results of Operations,” each included elsewhere in this prospectus.
| September 30, 2016 | ||||||||||||
| Actual | Pro Forma | Pro Forma as Adjusted(1) |
||||||||||
| (in thousands, except share and per share data) | ||||||||||||
| Cash, cash equivalents, and short-term investments |
$ | 76,771 | $ | 76,771 | $ | |||||||
|
|
|
|
|
|
|
|||||||
| Redeemable convertible preferred stock, par value $0.001 per share; 166,266,114 shares authorized, 166,266,114 shares issued and outstanding, actual; no shares authorized, issued or outstanding, pro forma and pro forma as adjusted |
$ | 543,095 | $ | — | $ | — | ||||||
|
|
|
|
|
|
|
|||||||
| Stockholders’ equity (deficit): |
||||||||||||
| Preferred stock, par value $0.001 per share; no shares authorized, issued and outstanding, actual; shares authorized and no shares issued and outstanding, pro forma and pro forma as adjusted |
— | — | — | |||||||||
| Common stock, par value $0.001 per share; 290,081,638 shares authorized, 43,534,572 shares issued and outstanding, actual; authorized, 209,800,686 shares issued and outstanding, pro forma; shares authorized, shares issued and outstanding, pro forma as adjusted |
44 | 210 | ||||||||||
| Additional paid-in capital |
37,962 | 201,958 | ||||||||||
| Accumulated equity (deficit) |
(487,075 | ) | (108,142 | ) | ||||||||
|
|
|
|
|
|
|
|||||||
| Total stockholders’ equity (deficit) |
(449,069 | ) | 94,026 | |||||||||
|
|
|
|
|
|
|
|||||||
| Total capitalization |
$ | 128,954 | $ | 128,954 | $ | |||||||
|
|
|
|
|
|
|
|||||||
| (1) | The pro forma as adjusted information below is illustrative only and will be adjusted based on the actual public offering price and other terms of this offering determined at pricing. A $1.00 increase (decrease) in the assumed initial public offering price of $ per share, which is the midpoint of the price range set forth on the cover page of this prospectus, would increase (decrease) our pro forma as adjusted cash, cash equivalents, and short-term investments, additional paid-in capital, total stockholders’ equity, and total capitalization by approximately $ million, assuming that the number of shares offered by us, as set forth on the cover page of this prospectus, remains the same, and after deducting the estimated underwriting discount. Similarly, each increase (decrease) of one million shares in the number of shares offered by us would increase (decrease) our pro forma as adjusted cash, cash equivalents, and short-term investments, additional paid-in capital, total |
47
| stockholders’ equity, and total capitalization by approximately $ million, assuming that the assumed initial public offering price, which is the midpoint of the price range set forth on the cover page of this prospectus, remains the same and after deducting the estimated underwriting discount. If the underwriters exercise their option to purchase additional shares of our common stock in full, the pro forma as adjusted amount of each of cash, cash equivalents, and short-term investments, additional paid-in capital, total stockholders’ equity and total capitalization would increase by approximately $ million, after deducting the estimated underwriting discount, and we would have shares of our common stock issued and outstanding, pro forma as adjusted. |
The number of shares of our common stock to be outstanding after this offering is based on 209,800,686 shares of our common stock outstanding as of September 30, 2016, and excludes:
| • | 38,040,107 shares of our common stock issuable upon the exercise of options outstanding as of September 30, 2016, with a weighted-average exercise price of $1.87 per share; |
| • | 2,827,713 shares of our common stock issuable upon the exercise of options that were granted after September 30, 2016, with an exercise price of $2.82 per share; and |
| • | shares of our common stock reserved for future issuance under our stock-based compensation plans, consisting of (1) 17,185,755 shares of our common stock reserved for future issuance under our Amended and Restated 2004 Equity Incentive Plan, which shares will be added to the shares to be reserved under our 2017 Equity Incentive Plan in connection with this offering, and (2) shares of our common stock reserved for future issuance under our 2017 Equity Incentive Plan, which will become effective in connection with this offering. |
48
If you invest in our common stock in this offering, your interest will be diluted immediately to the extent of the difference between the initial public offering price per share of our common stock and the pro forma as adjusted net tangible book value per share of our common stock immediately after this offering.
Our pro forma net tangible book value as of September 30, 2016 was $ million, or $ per share of common stock. Pro forma net tangible book value per share represents the amount of our total tangible assets less our total liabilities, divided by the number of shares of our common stock outstanding as of September 30, 2016, after giving effect to the automatic conversion of all shares of our redeemable convertible preferred stock outstanding as of September 30, 2016 into 166,266,114 shares of our common stock.
Pro forma as adjusted net tangible book value per share reflects the pro forma adjustments described above and the sale by us of shares of our common stock in this offering at an assumed initial public offering price of $ per share, which is the midpoint of the price range set forth on the cover page of this prospectus, and after deducting the estimated underwriting discount and estimated offering expenses. Our pro forma as adjusted net tangible book value as of September 30, 2016 would have been $ million, or $ per share. This amount represents an immediate increase in pro forma net tangible book value of $ per share to our existing stockholders and an immediate dilution in pro forma net tangible book value of $ per share to investors purchasing shares of our common stock in this offering at the assumed initial public offering price.
The following table illustrates this dilution on a per share basis to new investors:
| Assumed initial public offering price per share |
$ | |||||||
| Pro forma net tangible book value per share as of September 30, 2016 |
$ | |||||||
| Increase in pro forma net tangible book value per share attributable to new investors purchasing in this offering |
||||||||
|
|
|
|
|
|||||
| Pro forma as adjusted net tangible book value per share after this offering |
||||||||
|
|
|
|||||||
| Dilution in pro forma net tangible book value per share to investors in this offering |
$ | |||||||
|
|
|
A $1.00 increase (decrease) in the assumed initial public offering price of $ per share, which is the midpoint of the price range set forth on the cover page of this prospectus, would increase (decrease) our pro forma as adjusted net tangible book value per share after this offering by $ and would increase (decrease) dilution per share to investors in this offering by $ , assuming that the number of shares offered by us, as set forth on the cover page of this prospectus, remains the same, and after deducting the estimated underwriting discount. Similarly, each increase (decrease) of one million shares in the number of shares offered by us would increase (decrease) our pro forma as adjusted net tangible book value by $ and would decrease (increase) dilution per share to investors by $ , assuming that the assumed initial public offering price of $ per share, which is the midpoint of the price range set forth on the cover page of this prospectus, remains the same, and after deducting the estimated underwriting discount.
If the underwriters exercise their option to purchase additional shares of our common stock in full, the pro forma as adjusted net tangible book value per share after this offering would be $ per share, and the dilution in pro forma net tangible book value per share to new investors in this offering would be $ per share of our common stock.
49
The following table presents, on a pro forma as adjusted basis as described above, as of September 30, 2016, the differences between our existing stockholders and new investors purchasing shares of our common stock in this offering, with respect to the number of shares purchased from us, the total consideration paid to us, and the average price per share paid by our existing stockholders or to be paid to us by new investors purchasing shares in this offering at an assumed initial public offering price of $ per share, which is the midpoint of the price range set forth on the cover page of this prospectus, before deducting the estimated underwriting discount and estimated offering expenses.
| Shares Purchased | Total Consideration | Average Price Per Share |
||||||||||||||||||
| Number | Percent | Amount | Percent | |||||||||||||||||
| Existing stockholders |
% | $ | % | $ | ||||||||||||||||
| Investors in this offering |
||||||||||||||||||||
|
|
|
|
|
|
|
|
|
|||||||||||||
| Totals |
100.0 | % | $ | 100.0 | % | |||||||||||||||
|
|
|
|
|
|
|
|
|
|||||||||||||
A $1.00 increase (decrease) in the assumed initial public offering price of $ per share, which is the midpoint of the price range set forth on the cover page of this prospectus, would increase (decrease) the total consideration paid by new investors by $ million and increase (decrease) the percent of total consideration paid by new investors by %, assuming that the number of shares offered by us, as set forth on the cover page of this prospectus, remains the same and after deducting the estimated underwriting discount.
To the extent any outstanding stock options are exercised, investors participating in this offering will experience further dilution.
Except as otherwise indicated, the above discussion and tables assume no exercise of the underwriters’ option to purchase additional shares of our common stock. If the underwriters exercise their option to purchase additional shares of our common stock in full, our existing stockholders would own % and our new investors would own % of the total number of shares of our common stock outstanding upon the completion of this offering.
The number of shares of our common stock to be outstanding after this offering is based on 209,800,686 shares of our common stock outstanding as of September 30, 2016, and excludes:
| • | 38,040,107 shares of our common stock issuable upon the exercise of options outstanding as of September 30, 2016, with a weighted-average exercise price of $1.87 per share; |
| • | 2,827,713 shares of our common stock issuable upon the exercise of options that were granted after September 30, 2016, with an exercise price of $2.82 per share; and |
| • | shares of our common stock reserved for future issuance under our stock-based compensation plans, consisting of (1) 17,185,755 shares of our common stock reserved for future issuance under our Amended and Restated 2004 Equity Incentive Plan, which shares will be added to the shares to be reserved under our 2017 Equity Incentive Plan in connection with this offering, and (2) shares of our common stock reserved for future issuance under our 2017 Equity Incentive Plan, which will become effective in connection with this offering. |
50
SELECTED CONSOLIDATED FINANCIAL DATA
The following tables summarize our consolidated financial data. We derived our selected consolidated statements of operations data for the years ended December 31, 2014 and 2015, and our selected consolidated balance sheet data as of December 31, 2015 from our audited consolidated financial statements included elsewhere in this prospectus. We derived our selected consolidated balance sheet data as of December 31, 2014 from our audited consolidated financial statements not included in this prospectus. We derived our selected consolidated statements of operations data for the nine months ended September 30, 2015 and 2016 and our selected consolidated balance sheet data as of September 30, 2016 from our unaudited interim consolidated financial statements included elsewhere in this prospectus. Our unaudited interim consolidated financial statements have been prepared in accordance with U.S. generally accepted accounting principles, or GAAP, on the same basis as our audited annual consolidated financial statements and, in the opinion of management, reflect all adjustments, consisting only of normal, recurring adjustments, that are necessary for the fair presentation of our consolidated financial position as of September 30, 2016 and our consolidated results of operations for the nine months ended September 30, 2015 and 2016. Our historical results are not necessarily indicative of the results to be expected in the future, and the results for the nine months ended September 30, 2016 are not necessarily indicative of the results to be expected for the full year or any other period. You should read the following selected consolidated financial data in conjunction with “Management’s Discussion and Analysis of Financial Condition and Results of Operations” and our consolidated financial statements, the accompanying notes and other financial information included elsewhere in this prospectus.
| Year Ended December 31, | Nine Months Ended September 30, |
|||||||||||||||
| 2014 | 2015 | 2015 | 2016 | |||||||||||||
| (in thousands, except share and per share data) | ||||||||||||||||
| Consolidated Statements of Operations Data: |
||||||||||||||||
| Revenue |
$ | 125,363 | $ | 187,338 | $ | 141,605 | $ | 200,414 | ||||||||
| Cost of revenue(1) |
93,272 | 138,492 | 103,474 | 138,955 | ||||||||||||
|
|
|
|
|
|
|
|
|
|||||||||
| Gross profit |
32,091 | 48,846 | 38,131 | 61,459 | ||||||||||||
|
|
|
|
|
|
|
|
|
|||||||||
| Operating expenses: |
||||||||||||||||
| Technology and development(1) |
17,876 | 27,842 | 20,383 | 25,739 | ||||||||||||
| Marketing(1) |
15,058 | 19,899 | 15,011 | 23,133 | ||||||||||||
| General and administrative(1) |
24,240 | 31,394 | 24,237 | 29,948 | ||||||||||||
|
|
|
|
|
|
|
|
|
|||||||||
| Total operating expenses |
57,174 | 79,135 | 59,631 | 78,820 | ||||||||||||
|
|
|
|
|
|
|
|
|
|||||||||
| Income (loss) from operations |
(25,083 | ) | (30,289 | ) | (21,500 | ) | (17,361 | ) | ||||||||
|
|
|
|
|
|
|
|
|
|||||||||
| Interest income and other income, net: |
||||||||||||||||
| Interest income |
23 | 46 | 27 | 133 | ||||||||||||
| Other income, net |
24 | 7 | 8 | 37 | ||||||||||||
|
|
|
|
|
|
|
|
|
|||||||||
| Total interest income and other income, net |
47 | 53 | 35 | 170 | ||||||||||||
|
|
|
|
|
|
|
|
|
|||||||||
| Income (loss) before tax benefit (expense) |
(25,036 | ) | (30,236 | ) | (21,465 | ) | (17,191 | ) | ||||||||
| Income tax benefit (expense) |
306 | — | — | — | ||||||||||||
|
|
|
|
|
|
|
|
|
|||||||||
| Net income (loss) |
(24,730 | ) | (30,236 | ) | (21,465 | ) | (17,191 | ) | ||||||||
|
|
|
|
|
|
|
|
|
|||||||||
| Accretion of preferred stock |
(101,251 | ) | (102,224 | ) | (48,811 | ) | 56,819 | |||||||||
| Undistributed earnings attributable to participating securities |
— | — | — | (31,483 | ) | |||||||||||
|
|
|
|
|
|
|
|
|
|||||||||
| Net income (loss) attributable to common stock—basic |
$ | (125,981 | ) | $ | (132,460 | ) | $ | (70,276 | ) | $ | 8,145 | |||||
|
|
|
|
|
|
|
|
|
|||||||||
51
| Year Ended December 31, | Nine Months Ended September 30, |
|||||||||||||||
| 2014 | 2015 | 2015 | 2016 | |||||||||||||
| (in thousands, except share and per share data) | ||||||||||||||||
| Net income (loss) attributable to common stock—diluted |
$ | (125,981 | ) | $ | (132,460 | ) | $ | (70,276 | ) | $ | (17,191 | ) | ||||
|
|
|
|
|
|
|
|
|
|||||||||
| Net income (loss) per share attributable to common stock—basic(2) |
$ | (3.92 | ) | $ | (3.29 | ) | $ | (1.77 | ) | $ | 0.19 | |||||
|
|
|
|
|
|
|
|
|
|||||||||
| Net income (loss) per share attributable to common stock—diluted(2) |
$ | (3.92 | ) | $ | (3.29 | ) | $ | (1.77 | ) | $ | (0.08 | ) | ||||
|
|
|
|
|
|
|
|
|
|||||||||
| Weighted average shares used to compute net income (loss) per share attributable to common stock—basic(2) |
32,150,025 | 40,249,762 | 39,669,071 | 43,017,478 | ||||||||||||
|
|
|
|
|
|
|
|
|
|||||||||
| Weighted average shares used to compute net income (loss) per share attributable to common stock—diluted |
32,150,025 | 40,249,762 | 39,669,071 | 209,288,537 | ||||||||||||
|
|
|
|
|
|
|
|
|
|||||||||
| Pro forma net income (loss) per share attributable to common stock—basic and diluted(2) |
$ | (0.15 | ) | $ | (0.08 | ) | ||||||||||
|
|
|
|
|
|||||||||||||
| Pro forma weighted average shares used to compute net loss per share attributable to common stock—basic and diluted |
206,515,876 | 209,283,592 | ||||||||||||||
|
|
|
|
|
|||||||||||||
| (1) | Includes stock-based compensation as follows: |
| Year Ended December 31, | Nine Months Ended September 30, |
|||||||||||||||
| 2014 | 2015 | 2015 | 2016 | |||||||||||||
| (in thousands) | ||||||||||||||||
| Cost of revenue |
$ | 1,280 | $ | 1,440 | $ | 985 | $ | 1,589 | ||||||||
| Technology and development |
962 | 1,375 | 971 | 1,653 | ||||||||||||
| Marketing |
237 | 298 | 208 | 336 | ||||||||||||
| General and administrative |
2,717 | 2,449 | 1,881 | 2,312 | ||||||||||||
|
|
|
|
|
|
|
|
|
|||||||||
| Total |
$ | 5,196 | $ | 5,562 | $ | 4,045 | $ | 5,890 | ||||||||
|
|
|
|
|
|
|
|
|
|||||||||
| (2) | See Note 7 to our consolidated financial statements included elsewhere in this prospectus for an explanation of the calculations of our net (loss) income per share attributable to common stock, basic and diluted, and pro forma net income (loss) per share attributable to common stock, basic and diluted. |
| As of December 31, | As of September 30, 2016 |
|||||||||||
| 2014 | 2015 | |||||||||||
| (in thousands) | ||||||||||||
| Consolidated Balance Sheet Data: |
||||||||||||
| Cash, cash equivalents, and short-term investments |
$ | 112,127 | $ | 87,341 | $ | 76,771 | ||||||
| Working capital |
106,196 | 83,234 | 66,623 | |||||||||
| Total assets |
142,113 | 125,054 | 128,954 | |||||||||
| Redeemable convertible preferred stock |
497,699 | 599,914 | 543,095 | |||||||||
| Total stockholders’ equity (deficit) |
(370,595 | ) | (495,713 | ) | (449,069 | ) | ||||||
52
MANAGEMENT’S DISCUSSION AND ANALYSIS OF FINANCIAL CONDITION
AND RESULTS OF OPERATIONS
The following discussion and analysis of our financial condition and results of operations should be read in conjunction with our “Selected Consolidated Financial Data” and our consolidated financial statements, the accompanying notes, and other financial information included elsewhere in this prospectus. This discussion contains forward-looking statements that involve risks and uncertainties, such as our plans, estimates and beliefs. Our actual results could differ materially from those forward-looking statements below. Factors that could cause or contribute to those differences include, but are not limited to, those identified below and those discussed under “Risk Factors” included elsewhere in this prospectus.
Overview
Redfin is a technology-powered, residential real estate brokerage. We represent people buying and selling homes in over 80 markets throughout the United States. Our mission is to redefine real estate in the consumer’s favor. In a commission-driven industry, we put the customer first. We do this by pairing our own agents with our own technology to create a service that is faster, better, and costs less.
We’ve been advocating for customers for over 10 years. Our progress has been marked by technology-driven innovation and market expansion:
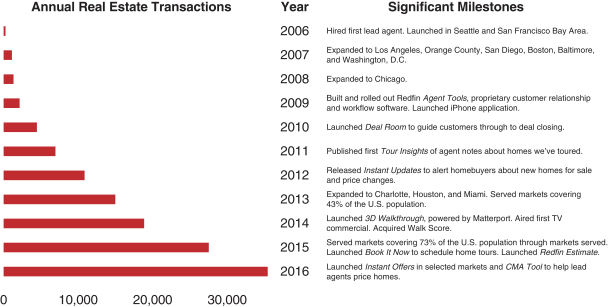
Our revenue model is straightforward. We employ lead agents supported by internal teams, who help customers buy and sell homes. We earn commissions when those transactions close. In some cases, we introduce customers to pre-approved, third-party agents through our Redfin Partner Program. These partner agents pay us a fee when they close a referred transaction.
53
We derive substantially all of our revenue when customers buy and sell homes. Our key revenue components are:
| • | Brokerage Revenue. We earn brokerage revenue from commissions we receive from representing homebuyers. Traditional brokerage buy-side commissions typically range from 2.5% to 3% of a home’s sale price, depending on the market. We typically provide a portion of this commission to our homebuyer through a commission refund or closing-cost reduction. We recognize the remaining commission amount as revenue. We also earn revenue from commissions we receive from representing home sellers. Typical traditional brokerage sell-side commissions range from 2.5% to 3% of a home’s sale price. Our sell-side commissions, which we recognize as revenue, are typically 1% to 1.5% of a home’s sale price, depending on the market and subject to market-by-market minimums. |
| • | Partner Revenue. Through the Redfin Partner Program, we refer customers to partner agents when we do not have a lead agent available to serve the customer due to high demand or geographic limitations. Partner agents pay us a fee representing a portion of the commission they receive when they close a referred transaction. We give a portion of this referral fee to the customer in certain circumstances and recognize the remaining amount as revenue. |
| • | Other Revenue. We offer services beyond helping customers buy and sell homes. For example, we provide title and settlement services in eight states and we also license data and analytics from Walk Score, our neighborhood walk-ability tool. We will consider new offerings going forward that further our goal of redefining the industry. To date, other revenue has not been material. |
We strive to be frugal with every expense, including capital expenditures and stock-based compensation. At the same time, we intend to continue to thoughtfully invest for long-term growth, with a focus on growing share in the markets we currently serve. We’ve invested, and expect to continue to invest, in marketing to promote the Redfin brand and in technology development to make the homebuying and home selling experience better and faster for our customers and our agents, while continuing to lower costs for our customers.
Our growth has been significant. For the years ended December 31, 2014 and 2015, we generated revenue of $125.4 million and $187.3 million, respectively, representing annual growth of 37% and 49%, respectively. For the nine months ended September 30, 2015 and 2016, we generated revenue of $141.6 million and $200.4 million, respectively, representing year-over-year growth of 42%. We generated net losses of $24.7 million and $30.2 million for the years ended December 31, 2014 and 2015, respectively, and $21.5 million and $17.2 million for the nine months ended September 30, 2015 and 2016, respectively.
54
Key Business Metrics
In addition to the measures presented in our consolidated financial statements, we use the following key metrics to evaluate our business, develop financial forecasts and make strategic decisions. For information about the methodologies we use to calculate our key business metrics, please see “Industry and Market Data and Calculation of Key Business Metrics.”
| Year Ended December 31, |
Nine Months Ended September 30, |
|||||||||||||||
| 2014 | 2015 | 2015 | 2016 | |||||||||||||
| Monthly average visitors (in thousands) |
8,720 | 11,705 | 11,892 | 16,267 | ||||||||||||
| Real estate transactions: |
||||||||||||||||
| Brokerage |
12,688 | 18,586 | 14,076 | 19,436 | ||||||||||||
| Partner |
6,144 | 8,906 | 6,633 | 7,201 | ||||||||||||
|
|
|
|
|
|
|
|
|
|||||||||
| Total |
18,832 | 27,492 | 20,709 | 26,637 | ||||||||||||
|
|
|
|
|
|
|
|
|
|||||||||
| Real estate revenue per real estate transaction: |
||||||||||||||||
| Brokerage |
$ | 9,119 | $ | 9,215 | $ | 9,207 | $ | 9,438 | ||||||||
| Partner |
993 | 1,142 | 1,130 | 1,634 | ||||||||||||
| Aggregate |
6,468 | 6,600 | 6,620 | 7,328 | ||||||||||||
| Aggregate home value of real estate transactions |
8,412 | 12,296 | 9,312 | 12,181 | ||||||||||||
| U.S. market share by value |
0.33 | % | 0.44 | % | 0.43 | % | 0.53 | % | ||||||||
| Revenue from top-10 Redfin markets as a percentage of real estate revenue |
80 | % | 75 | % | 76 | % | 72 | % | ||||||||
| Average number of lead agents |
422 | 591 | 566 | 752 | ||||||||||||
Monthly Average Visitors
The number of, and growth in, visitors to our website and mobile application are important leading indicators of our business activity because these channels are the primary ways we meet and serve customers. For a particular period, monthly average visitors refers to the average of the number of unique visitors to our website and mobile application for each of the months in that period. Monthly average visitors are influenced by market conditions that affect interest in buying or selling homes, the level and success of our marketing programs, as well as seasonality. We believe we can continue to increase monthly visitors, allowing us to grow.
Real Estate Transactions
Increasing the number of real estate transactions in which we or our partner agents represent homebuyers and home sellers is critical to increasing our revenue and, in turn, to achieving profitability. Real estate transactions are influenced by pricing for our services as well as market conditions that affect home sales such as local inventory levels and mortgage interest rates. Real estate transactions are also affected by seasonality and macroeconomic factors.
Real Estate Revenue per Real Estate Transaction
Real estate revenue per real estate transaction, together with the number of real estate transactions, is a factor in evaluating business growth and determining pricing. Changes in revenue per real estate transaction can be affected by our pricing, the mix of transactions for homebuyers and home sellers, changes in the value of homes in the markets we serve, the geographic mix of our transactions, and the transactions we refer to partner agents. We generally generate more real estate revenue per brokerage transaction from representing homebuyers than home sellers.
55
From 2014 through 2016, brokerage transactions for home sellers as a percentage of brokerage transactions increased from slightly over 20% to slightly over 30%. We expect brokerage transactions for home sellers to comprise a greater portion of our brokerage transactions over time as we continue to focus on listings as a strategic asset that provides benefits beyond the revenue we generate from home sellers. For example, we believe that increased listings draw more homebuyers to our website and mobile application.
Aggregate Home Value of Real Estate Transactions
The aggregate home value of real estate transactions completed by our lead agents and the transactions we refer to partner agents is an important indicator of the health of our business because our revenue is based on a percentage of each home’s sale price. This metric is affected by changes in home values in the markets we serve and by changes in the number of customers who use our services as well as seasonality and macroeconomic factors.
U.S. Market Share by Value
Increasing our U.S. market share is critical to our ability to grow our business and achieve profitability over the long term. We believe there is a significant opportunity to increase our share in the markets we currently serve.
Revenue from Top-10 Markets as a Percentage of Real Estate Revenue
We plan to continue to diversify our growth into the future and to increase our market share in our newer markets. We expect our revenue from top-10 markets to decline as a percentage of our real estate revenue over time.
Average Number of Lead Agents
The average number of lead agents, in combination with our other key metrics such as the number of brokerage transactions, is a measure of agent productivity and is an indicator of the potential future growth of our business. We systematically evaluate traffic to our website and mobile application and customer activity to anticipate changes in customer demand to determine when and where to hire lead agents.
Our lead agents are employees who receive a salary, variable transaction bonuses based on customer satisfaction and transaction value, benefits, and expense reimbursement. Base pay represented approximately 27% of total lead agent cash compensation in 2016.
Market Cohorts
Our growth strategy is based on our belief that, as we gain local market share, our brand awareness and ability to provide efficient service in each market we serve will increase, which will, in turn, promote additional market share gains and further efficiencies in those markets. To demonstrate progress in the more than 80 markets we serve, we group markets in which we began operating in similar timeframes into three cohorts that illustrate this cycle. We chose this grouping of markets so the total market transaction value is similar across the cohorts.
We have gained market share, increased revenue, increased real estate revenue per brokerage transaction, and increased real estate gross margin in all of the cohorts in each of the years presented. From year-to-year, our market share gains have been largely consistent within cohorts.
56
Our first cohort primarily consists of major metropolitan areas, such as Seattle, San Francisco, Los Angeles, Boston, Washington, D.C., and Chicago. A number of factors may limit our ability to replicate our financial results of our first cohort in our other two cohorts, including that the mean home sale price in our earliest cohort of markets is significantly higher than the mean home price in the later two cohorts. As a result, we cannot ensure that we will experience similar financial outcomes from our later cohorts or in any future markets we may serve. However, we believe the continued market share growth trend in our earliest cohort demonstrates possible revenue growth rate and margin trends over time as our newer markets mature.
| Cohort Of Markets Opened In Years | ||||||||||||
| 2006-2008 | 2009-2013 | 2014-2016 | ||||||||||
| Number of markets |
10 | 19 | 55 | |||||||||
| 2016 completed market transactions (in billions) |
$ | 328 | $ | 319 | $ | 265 | ||||||
| 2016 mean home sale price |
$ | 530,617 | $ | 313,180 | $ | 245,684 | ||||||
| Market share by value: |
||||||||||||
| 2014 |
1.15 | % | 0.29 | % | 0.02 | % | ||||||
| 2015 |
1.41 | 0.39 | 0.10 | |||||||||
| 2016 |
1.66 | 0.47 | 0.20 | |||||||||
| Real estate revenue (in thousands): |
||||||||||||
| 2014 |
$ | 97,801 | $ | 23,214 | $ | 789 | ||||||
| 2015 |
136,261 | 38,079 | 7,106 | |||||||||
| 2016 |
186,919 | 56,259 | 17,200 | |||||||||
| Real estate revenue per brokerage transaction: |
||||||||||||
| 2014 |
$ | 9,590 | $ | 7,580 | $ | 6,419 | ||||||
| 2015 |
9,889 | 7,772 | 6,859 | |||||||||
| 2016 |
10,208 | 7,991 | 7,456 | |||||||||
| Real estate gross margin: |
||||||||||||
| 2014 |
29.3 | % | 17.6 | % | N.M. | |||||||
| 2015 |
30.2 | 23.1 | (6.8 | )% | ||||||||
| 2016 |
34.1 | 28.1 | 19.9 | |||||||||
Factors Affecting Performance
Seasonality
Residential real estate is a highly seasonal business. While individual markets may vary, transaction volume typically increases progressively from January through the summer months and then declines gradually over the last three to four months of the calendar year. We experience the most significant financial effect from this seasonality in the first and fourth quarters of each year, when our revenue is typically lower relative to the second and third quarters. However, because we employ our lead agents and a portion of their compensation is fixed, we do not experience a proportional decrease in our expenses during such lower seasonal periods, which negatively affects our operating results.
Cyclicality
The residential real estate industry is cyclical and, when economic conditions are favorable, the real estate industry tends to perform well. When the economy is weak, if interest rates dramatically increase, if mortgage lending standards tighten, or if there are economic or political disturbances, the residential real estate industry tends to perform poorly. Our revenue growth rate tends to increase as the real estate industry performs well, and decrease as it performs poorly.
57
Ability to Gain Market Share
Our ability to gain market share in the markets we serve will be influenced by our ability to compete in each individual market. The residential real estate industry is subject to local dynamics, as each market has its own characteristics, and individual agents tend to focus on certain neighborhoods within these markets. Many of our competitors have agents with long-standing reputations and relationships in individual markets and may have specialized expertise related to local dynamics that our agents may not. Our market share growth will be influenced by our ability to compete in individual, local neighborhoods. Given the varying characteristics of each market, gains in any individual market are difficult to predict and not all of our markets will have the same challenges or rewards.
Pricing
Delivering a better customer experience at a lower cost than our competitors is a fundamental tenet of our strategy. We believe that in the long run our technology-powered, residential brokerage model will further drive efficiencies that continue to reduce costs. From time to time, we adjust pricing after considering market conditions, the balance of profitability against customer savings and other factors. Based on prior pricing changes, we believe that home sellers are more sensitive to pricing than homebuyers.
Agent Productivity and Partner Mix
We hire lead agents in anticipation of customer demand, so we have the necessary capacity of trained lead agents to help homebuyers and home sellers. We manage the capacity of our lead agents, as we want them to be busy working with customers but not so busy that customer satisfaction declines. As we hire lead agents, we also add staffing to support these agents. We adjust staffing levels in each market we serve, but also transactional support from a national hub located in the greater Chicago area, letting us re-allocate support staff to the markets that need it most, which creates some economies of scale.
The Redfin Partner Program is designed to moderate the effects of industry seasonality and cyclicality. We adjust the portion of customers who are served by partner agents in each of the markets we serve to maintain an effective balance between capacity utilization and customer service. Rather than countering seasonal and cyclical changes in demand by hiring a surplus of lead agents in each neighborhood, we rely on partners to handle demand swings.
Investments in Technology and Marketing
We have invested, and intend to continue to invest, in developing technology, tools, features and products that provide targeted and useful real estate information to customers, manage their real estate transaction, and make our lead agents and internal teams more efficient. In addition, we will continue to invest in marketing to increase our market share in the markets we serve. Any investments we make in these areas will occur before we experience benefits, if any, from the investments. Furthermore, the effectiveness of these efforts may be difficult to measure.
Components of our Results of Operations
Revenue
We generate revenue primarily from commissions and fees charged on real estate transactions closed by us or partner agents as well as from other services we provide.
58
Real Estate Revenue
Brokerage Revenue. Brokerage revenue consists of commissions earned on real estate transactions closed by our lead agents. We recognize commission-based revenue upon the closing of a transaction, less the amount of any commission refund or any closing-cost reduction, commission discount, or transaction fee adjustment. Brokerage revenue is affected by the number of real estate transactions we close, the mix of brokerage transactions, home sale prices, commission rates, and the amount we give to customers.
Partner Revenue. Partner revenue consists of fees partner agents pay us when they close referred transactions, less the amount of any payments we make to customers. We recognize these fees as revenue upon the closing of a transaction. Partner revenue is affected by the number of partner transactions closed, home sale prices, commission rates, and the amount we give to customers.
Other Revenue
Other revenue consists of fees charged for title and settlement services, marketing services provided to home builders by our builder services group, licensing and analytics fees from our Walk Score service, and other services. Revenue is recognized when the service is provided.
Cost of Revenue and Gross Margin
Cost of revenue consists primarily of personnel costs (including base pay and benefits), stock-based compensation, transaction bonuses, tour and field expenses, listing expenses, business expenses, and facilities expenses. We expect cost of revenue to continue to rise, but more slowly than revenue, as we hire more lead agents and support staff in response to anticipated customer demand.
Gross profit is revenue less cost of revenue. Gross margin is gross profit expressed as a percentage of revenue. Our gross margin has and will continue to be affected by a number of factors, including real estate revenue per real estate transaction and the productivity of our lead agents and support staff. We expect gross margin to continue to rise over time to the extent we gain efficiencies through technology and operations.
Operating Expenses
Technology and Development
Technology and development expenses relate primarily to developing new software used by our customers and internal teams, making enhancements to our existing software, and maintaining and improving our website and mobile application. These expenses consist primarily of personnel costs, stock-based compensation, data licenses, software, and equipment and infrastructure such as for data centers and hosted services. Technology and development expenses also include amortization of capitalized internal-use software and website and mobile application development costs. We expect technology and development expenses to continue to increase in absolute dollars as we hire more software developers. We anticipate technology and development expenses as a percentage of revenue to decrease over time.
Marketing
Marketing expenses consist primarily of media costs for online and traditional advertising, as well as personnel costs and stock-based compensation. We expect marketing expenses to increase in absolute dollars as we expand advertising programs. We anticipate marketing expenses as a percentage of revenue to decrease over time.
59
General and Administrative
General and administrative expenses consist primarily of personnel costs, stock-based compensation, facilities, and related expenses for our executive, finance, human resources, facilities and legal organizations, and fees for professional services. Professional services are principally comprised of external legal, audit and tax services. We expect general and administrative expenses to increase in absolute dollars due to the anticipated growth of our business and to meet the increased compliance requirements associated with our transition to, and operation as, a public company. We anticipate general and administrative expenses as a percentage of revenue to decrease over time.
60
Results of Operations
The following tables set forth our results of operations for the periods presented and as a percentage of our revenue for those periods. The period-to-period comparisons of our historical results are not necessarily indicative of the results that may be expected in the future.
| Year Ended December 31, | Nine Months Ended September 30, |
|||||||||||||||||||||||||||||||
| 2014 | 2015 | 2015 | 2016 | |||||||||||||||||||||||||||||
| (in thousands) | ||||||||||||||||||||||||||||||||
| Revenue |
$ | 125,363 | $ | 187,338 | $ | 141,605 | $ | 200,414 | ||||||||||||||||||||||||
| Cost of revenue(1) |
93,272 | 138,492 | 103,474 | 138,955 | ||||||||||||||||||||||||||||
|
|
|
|
|
|
|
|
|
|||||||||||||||||||||||||
| Gross profit |
32,091 | 48,846 | 38,131 | 61,459 | ||||||||||||||||||||||||||||
|
|
|
|
|
|
|
|
|
|||||||||||||||||||||||||
| Operating expenses: |
||||||||||||||||||||||||||||||||
| Technology and development(1) |
17,876 | 27,842 | 20,383 | 25,739 | ||||||||||||||||||||||||||||
| Marketing(1) |
15,058 | 19,899 | 15,011 | 23,133 | ||||||||||||||||||||||||||||
| General and administrative(1) |
24,240 | 31,394 | 24,237 | 29,948 | ||||||||||||||||||||||||||||
|
|
|
|
|
|
|
|
|
|||||||||||||||||||||||||
| Total operating expenses |
57,174 | 79,135 | 59,631 | 78,820 | ||||||||||||||||||||||||||||
|
|
|
|
|
|
|
|
|
|||||||||||||||||||||||||
| Income (loss) from operations |
(25,083 | ) | (30,289 | ) | (21,500 | ) | (17,361 | ) | ||||||||||||||||||||||||
|
|
|
|
|
|
|
|
|
|||||||||||||||||||||||||
| Total interest income and other income, net |
47 | 53 | 35 | 170 | ||||||||||||||||||||||||||||
| Income (loss) before tax benefit (expense) |
(25,036 | ) | (30,236 | ) | (21,465 | ) | (17,191 | ) | ||||||||||||||||||||||||
| Income tax benefit (expense) |
306 | — | — | — | ||||||||||||||||||||||||||||
|
|
|
|
|
|
|
|
|
|||||||||||||||||||||||||
| Net income (loss) |
$ | (24,730 | ) | $ | (30,236 | ) | $ | (21,465 | ) | $ | (17,191 | ) | ||||||||||||||||||||
|
|
|
|
|
|
|
|
|
|||||||||||||||||||||||||
| Year Ended December 31, | Nine Months Ended September 30, |
|||||||||||||||||||||||||||||||
| 2014 | 2015 | 2015 | 2016 | |||||||||||||||||||||||||||||
| (in thousands) | ||||||||||||||||||||||||||||||||
|
|
||||||||||||||||||||||||||||||||
| (1) Includes stock-based compensation as follows: | ||||||||||||||||||||||||||||||||
| Cost of revenue |
$ | 1,280 | $ | 1,440 | $ | 985 | $ | 1,589 | ||||||||||||||||||||||||
| Technology and development |
962 | 1,375 | 971 | 1,653 | ||||||||||||||||||||||||||||
| Marketing |
237 | 298 | 208 | 336 | ||||||||||||||||||||||||||||
| General and administrative |
2,717 | 2,449 | 1,881 | 2,312 | ||||||||||||||||||||||||||||
|
|
|
|
|
|
|
|
|
|||||||||||||||||||||||||
| Total |
$ | 5,196 | $ | 5,562 | $ | 4,045 | $ | 5,890 | ||||||||||||||||||||||||
|
|
|
|
|
|
|
|
|
|||||||||||||||||||||||||
61
| Year Ended December 31, | Nine Months Ended September 30, |
|||||||||||||||||||||||||||||||
| 2014 | 2015 | 2015 | 2016 | |||||||||||||||||||||||||||||
| (as a percentage of revenue) | ||||||||||||||||||||||||||||||||
| Revenue |
100.0 | % | 100.0 | % | 100.0 | % | 100.0 | % | ||||||||||||||||||||||||
| Cost of revenue(1) |
74.4 | 73.9 | 73.1 | 69.3 | ||||||||||||||||||||||||||||
|
|
|
|
|
|
|
|
|
|||||||||||||||||||||||||
| Gross profit |
25.6 | 26.1 | 26.9 | 30.7 | ||||||||||||||||||||||||||||
|
|
|
|
|
|
|
|
|
|||||||||||||||||||||||||
| Operating expenses: |
||||||||||||||||||||||||||||||||
| Technology and development(1) |
14.3 | 14.9 | 14.4 | 12.8 | ||||||||||||||||||||||||||||
| Marketing(1) |
12.0 | 10.6 | 10.6 | 11.5 | ||||||||||||||||||||||||||||
| General and administrative(1) |
19.3 | 16.8 | 17.1 | 14.9 | ||||||||||||||||||||||||||||
|
|
|
|
|
|
|
|
|
|||||||||||||||||||||||||
| Total operating expenses |
45.6 | 42.2 | 42.1 | 39.3 | ||||||||||||||||||||||||||||
|
|
|
|
|
|
|
|
|
|||||||||||||||||||||||||
| Income (loss) from operations |
(20.0 | ) | (16.2 | ) | (15.2 | ) | (8.7 | ) | ||||||||||||||||||||||||
|
|
|
|
|
|
|
|
|
|||||||||||||||||||||||||
| Total interest income and other income, net |
— | — | — | 0.1 | ||||||||||||||||||||||||||||
| Income (loss) before tax benefit (expense) |
(20.0 | ) | (16.1 | ) | (15.2 | ) | (8.6 | ) | ||||||||||||||||||||||||
| Income tax benefit (expense) |
0.2 | — | — | — | ||||||||||||||||||||||||||||
|
|
|
|
|
|
|
|
|
|||||||||||||||||||||||||
| Net income (loss) |
(19.7 | )% | (16.1 | )% | (15.2 | )% | (8.6 | )% | ||||||||||||||||||||||||
|
|
|
|
|
|
|
|
|
|||||||||||||||||||||||||
| Year Ended December 31, | Nine Months Ended September 30, | |||||||||||||||||||||||||||||||
| 2014 | 2015 | 2015 | 2016 | |||||||||||||||||||||||||||||
| (as a percentage of revenue) | ||||||||||||||||||||||||||||||||
|
|
||||||||||||||||||||||||||||||||
| (1) Includes stock-based compensation as follows: |
||||||||||||||||||||||||||||||||
| Cost of revenue |
1.0 | % | 0.8 | % | 0.7 | % | 0.8 | % | ||||||||||||||||||||||||
| Technology and development |
0.8 | 0.7 | 0.7 | 0.8 | ||||||||||||||||||||||||||||
| Marketing |
0.2 | 0.2 | 0.1 | 0.2 | ||||||||||||||||||||||||||||
| General and administrative |
2.2 | 1.3 | 1.3 | 1.2 | ||||||||||||||||||||||||||||
|
|
|
|
|
|
|
|
|
|||||||||||||||||||||||||
| Total |
4.1 | % | 3.0 | % | 2.9 | % | 2.9 | % | ||||||||||||||||||||||||
|
|
|
|
|
|
|
|
|
|
|
|
|
|
|
|
|
|||||||||||||||||
Comparison of the Nine Months Ended September 30, 2015 and 2016
Revenue
| Nine Months Ended September 30, |
Change | |||||||||||||||||||||||||||||||
| 2015 | 2016 | Dollars | Percentage | |||||||||||||||||||||||||||||
| (in thousands, except percentages) | ||||||||||||||||||||||||||||||||
| Real estate revenue: |
||||||||||||||||||||||||||||||||
| Brokerage revenue |
$ | 129,595 | $ | 183,440 | $ | 53,845 | 42 | % | ||||||||||||||||||||||||
| Partner revenue |
7,495 | 11,764 | 4,269 | 57 | ||||||||||||||||||||||||||||
|
|
|
|
|
|
|
|||||||||||||||||||||||||||
| Total real estate revenue |
137,090 | 195,203 | 58,113 | 42 | ||||||||||||||||||||||||||||
| Other revenue |
4,515 | 5,211 | 696 | 15 | ||||||||||||||||||||||||||||
|
|
|
|
|
|
|
|||||||||||||||||||||||||||
| Revenue |
$ | 141,605 | $ | 200,414 | $ | 58,809 | 42 | |||||||||||||||||||||||||
|
|
|
|
|
|
|
|||||||||||||||||||||||||||
| Percentage of revenue |
||||||||||||||||||||||||||||||||
| Real estate revenue: |
||||||||||||||||||||||||||||||||
| Brokerage |
91.5 | % | 91.5 | % | ||||||||||||||||||||||||||||
| Partner revenue |
5.3 | 5.9 | ||||||||||||||||||||||||||||||
|
|
|
|
|
|||||||||||||||||||||||||||||
| Total real estate revenue |
96.8 | 97.4 | ||||||||||||||||||||||||||||||
| Other revenue |
3.2 | 2.6 | ||||||||||||||||||||||||||||||
|
|
|
|
|
|||||||||||||||||||||||||||||
| Revenue |
100.0 | % | 100.0 | % | ||||||||||||||||||||||||||||
|
|
|
|
|
|
|
|
|
|
|
|||||||||||||||||||||||
62
Revenue increased by $58.8 million, or 42%, in the nine months ended September 30, 2016, as compared with the same period in 2015. Brokerage revenue represented $53.8 million, or 92%, of the increase. Brokerage revenue grew 42% during the period, driven by a 38% increase in brokerage real estate transactions and a 2% increase in real estate revenue per real estate transaction. The increase in brokerage transactions was attributable to higher levels of customer awareness of Redfin and increasing customer demand and market share in most of our markets.
In late 2015, we reduced the amount of our average commission refund or closing-cost adjustment by approximately $550. This change in pricing positively affected our real estate revenue per brokerage transaction in early 2016 as those transactions began to close. In early 2016, we changed pricing and the structure of the Redfin Partner Program. Instead of paying 15% of the commissions partner agents earned through the program to us, partner agents began paying us 30%. At the same time, we began directly issuing a $500 check to certain partner program customers, partially offsetting the increase in referral fees paid by partner agents. These changes to our partner program positively affected our real estate revenue per partner transaction in 2016.
Cost of Revenue and Gross Margin
| Nine Months Ended September 30, | Change | |||||||||||||||||||||||||||||||
| 2015 | 2016 | Dollars | Percentage | |||||||||||||||||||||||||||||
| (in thousands, except percentages) | ||||||||||||||||||||||||||||||||
| Cost of revenue |
$ | 103,474 | $ | 138,955 | $ | 35,481 | 34 | % | ||||||||||||||||||||||||
|
|
|
|
|
|
|
|||||||||||||||||||||||||||
| Gross profit |
38,131 | 61,459 | 23,328 | 61 | ||||||||||||||||||||||||||||
|
|
|
|
|
|
|
|||||||||||||||||||||||||||
| Percentage of revenue |
||||||||||||||||||||||||||||||||
| Gross margin |
26.9 | % | 30.7 | % | ||||||||||||||||||||||||||||
In the nine months ended September 30, 2016, cost of revenue increased by $35.5 million, or 34%, as compared with the same period in 2015. This increase in cost of revenue was primarily attributable to a $13.6 million increase in personnel costs due to increased lead agent and related support staff headcount, a $10.6 million increase in transaction bonuses, and a $6.4 million increase in tour and field costs.
Gross margin increased 378 basis points for the nine months ended September 30, 2016 as compared with the same period in 2015. This was primarily attributable to a 202 basis point reduction in personnel costs and an 87 basis point reduction in occupancy and office expenses as a percentage of revenue.
Operating Expenses
| Nine Months Ended September 30, |
Change | |||||||||||||||||||||||||||||||
| 2015 | 2016 | Dollars | Percentage | |||||||||||||||||||||||||||||
| (in thousands, except percentages) | ||||||||||||||||||||||||||||||||
| Technology and development |
$ | 20,383 | $ | 25,739 | $ | 5,356 | 26 | % | ||||||||||||||||||||||||
| Marketing |
15,011 | 23,133 | 8,122 | 54 | ||||||||||||||||||||||||||||
| General and administrative |
24,237 | 29,948 | 5,711 | 24 | ||||||||||||||||||||||||||||
|
|
|
|
|
|
|
|||||||||||||||||||||||||||
| Total operating expenses |
$ | 59,631 | $ | 78,820 | $ | 19,189 | 32 | |||||||||||||||||||||||||
|
|
|
|
|
|
|
|
|
|
|
|
|
|
|
|||||||||||||||||||
| Percentage of revenue |
||||||||||||||||||||||||||||||||
| Technology and development |
14.4 | % | 12.8 | % | ||||||||||||||||||||||||||||
| Marketing |
10.6 | 11.5 | ||||||||||||||||||||||||||||||
| General and administrative |
17.1 | 14.9 | ||||||||||||||||||||||||||||||
|
|
|
|
|
|||||||||||||||||||||||||||||
| Total operating expenses |
42.1 | % | 39.3 | % | ||||||||||||||||||||||||||||
|
|
|
|
|
|
|
|
|
|
|
|
|
|||||||||||||||||||||
63
In the nine months ended September 30, 2016, technology and development expenses increased by $5.4 million, or 26%, as compared with the same period in 2015. The increase was primarily attributable to a $3.3 million increase in personnel costs due to increased headcount. The increase was also due to a $0.9 million increase in amortization expense related to our internal-use software. The increase was partially offset by a $0.4 million decrease due to reduced use of contract software developers.
In the nine months ended September 30, 2016, marketing expenses increased by $8.1 million, or 54%, as compared with the same period in 2015. The increase was primarily attributable to an $8.5 million increase in marketing media costs as we expanded advertising, partially offset by a $0.8 million decrease in personnel expenses.
In the nine months ended September 30, 2016, general and administrative expenses increased by $5.7 million, or 24%, as compared with the same period in 2015. The increase was primarily attributable to a $3.2 million increase in personnel costs, largely the result of increases in headcount to support continued growth.
Comparison of the Years Ended December 31, 2014 and 2015
Revenue
| Year Ended December 31, | Change | |||||||||||||||||||||||||||||||
| 2014 | 2015 | Dollars | Percentage | |||||||||||||||||||||||||||||
| (in thousands, except percentages) | ||||||||||||||||||||||||||||||||
| Real estate revenue: |
||||||||||||||||||||||||||||||||
| Brokerage revenue |
$ | 115,701 | $ | 171,276 | $ | 55,575 | 48 | % | ||||||||||||||||||||||||
| Partner revenue |
6,103 | 10,170 | 4,067 | 67 | ||||||||||||||||||||||||||||
|
|
|
|
|
|
|
|||||||||||||||||||||||||||
| Total real estate revenue |
121,804 | 181,446 | 59,642 | 49 | ||||||||||||||||||||||||||||
| Other revenue |
3,559 | 5,892 | 2,333 | 66 | ||||||||||||||||||||||||||||
|
|
|
|
|
|
|
|||||||||||||||||||||||||||
| Revenue |
$ | 125,363 | $ | 187,338 | $ | 61,975 | 49 | |||||||||||||||||||||||||
|
|
|
|
|
|
|
|||||||||||||||||||||||||||
| Percentage of revenue |
||||||||||||||||||||||||||||||||
| Real estate revenue: |
||||||||||||||||||||||||||||||||
| Brokerage revenue |
92.3 | % | 91.4 | % | ||||||||||||||||||||||||||||
| Partner revenue |
4.9 | 5.4 | ||||||||||||||||||||||||||||||
|
|
|
|
|
|||||||||||||||||||||||||||||
| Total real estate revenue |
97.2 | 96.9 | ||||||||||||||||||||||||||||||
| Other revenue |
2.8 | 3.1 | ||||||||||||||||||||||||||||||
|
|
|
|
|
|||||||||||||||||||||||||||||
| Revenue |
100.0 | % | 100.0 | % | ||||||||||||||||||||||||||||
|
|
|
|
|
|
|
|||||||||||||||||||||||||||
In 2015, revenue increased by $62.0 million, or 49%, as compared with 2014. Brokerage revenue was responsible for $55.6 million, or 90%, of this increase. Brokerage revenue grew 48% during the year, primarily attributable to a 47% increase in brokerage transactions and a 1% increase in real estate revenue per brokerage transaction. The increase in brokerage transactions was primarily attributable to higher levels of customer awareness of Redfin and increasing customer demand and market share in most of our markets.
In late 2014, we reduced our sell-side commission from 1.5% to 1% in Washington, D.C., Virginia and Maryland with the goal of increasing sell-side demand in these markets. We offset this price change in part by reducing our commission refund or closing-cost adjustment in these three markets. Also in late 2014, we reduced the average commission refund or closing-cost adjustment by approximately $300 in the markets we served other than Washington, D.C., Virginia and Maryland. The effect of these changes was reflected in our 2015 results, as transactions reflecting these new pricing policies began to close.
64
Cost of Revenue and Gross Margin
| Year Ended December 31, | Change | |||||||||||||||||||||||||||||||
| 2014 | 2015 | Dollars | Percentage | |||||||||||||||||||||||||||||
| (in thousands, except percentages) | ||||||||||||||||||||||||||||||||
| Cost of revenue |
$ | 93,272 | $ | 138,492 | $ | 45,220 | 48 | % | ||||||||||||||||||||||||
|
|
|
|
|
|
|
|||||||||||||||||||||||||||
| Gross profit |
$ | 32,091 | $ | 48,846 | $ | 16,755 | 52 | |||||||||||||||||||||||||
|
|
|
|
|
|
|
|||||||||||||||||||||||||||
| Percentage of revenue |
||||||||||||||||||||||||||||||||
| Gross margin |
25.6 | % | 26.1 | % | ||||||||||||||||||||||||||||
In 2015, cost of revenue increased $45.2 million, or 48%, as compared with 2014. This increase in cost of revenue was primarily attributable to an $18.1 million increase in personnel costs due to increased lead agent and related support staff headcount, a $12.9 million increase in transaction bonuses, and a $7.7 million increase in tour and field costs.
Gross margin increased 48 basis points for 2015 as compared with 2014. This was primarily attributable to an 85 basis point reduction in personnel costs, a 46 basis point reduction in occupancy and office expenses, and a 33 basis point reduction in operating expenses as a percentage of revenue. This was partially offset by a 119 basis point increase in transaction bonuses as a percentage of revenue.
Operating Expenses
| Year Ended December 31, | Change | |||||||||||||||||||||||||||||||
| 2014 | 2015 | Dollars | Percentage | |||||||||||||||||||||||||||||
| (in thousands, except percentages) | ||||||||||||||||||||||||||||||||
| Technology and development |
$ | 17,876 | $ | 27,842 | $ | 9,966 | 56 | % | ||||||||||||||||||||||||
| Marketing |
15,058 | 19,899 | 4,841 | 32 | ||||||||||||||||||||||||||||
| General and administrative |
24,240 | 31,394 | 7,154 | 30 | ||||||||||||||||||||||||||||
|
|
|
|
|
|
|
|||||||||||||||||||||||||||
| Total operating expenses |
$ | 57,174 | $ | 79,135 | $ | 21,961 | 38 | |||||||||||||||||||||||||
|
|
|
|
|
|
|
|
|
|
|
|||||||||||||||||||||||
| Percentage of revenue |
||||||||||||||||||||||||||||||||
| Technology and development |
14.3 | % | 14.9 | % | ||||||||||||||||||||||||||||
| Marketing |
12.0 | 10.6 | ||||||||||||||||||||||||||||||
| General and administrative |
19.3 | 16.8 | ||||||||||||||||||||||||||||||
|
|
|
|
|
|||||||||||||||||||||||||||||
| Total operating expenses |
45.6 | % | 42.2 | % | ||||||||||||||||||||||||||||
|
|
|
|
|
|
|
|
|
|||||||||||||||||||||||||
In 2015, technology and development expenses increased by $10.0 million, or 56%, as compared with 2014. The increase was primarily attributable to a $7.5 million increase in personnel costs due to increased headcount as we continued to build technology for customers and our internal teams. Amortization expense related to our internal-use software increased by $1.1 million.
In 2015, marketing expenses increased by $4.8 million, or 32%, as compared with 2014. The increase was primarily attributable to a $3.5 million increase in marketing media costs as we expanded advertising.
In 2015, general and administrative expenses increased by $7.2 million, or 30%, as compared with 2014. The increase was primarily attributable to a $4.6 million increase in personnel costs, largely the result of increases in headcount to support the continued growth of our business. Outside professional services expenses increased by $1.5 million.
65
Quarterly Results of Operations and Key Business Metrics
The following tables set forth our unaudited quarterly statements of operations data for each of the seven quarters in the period ended September 30, 2016, as well as the percentage that each line item represents of our revenue for each quarter presented. The information for each quarter has been prepared on a basis consistent with our audited consolidated financial statements included in this prospectus, and reflect, in the opinion of management, all adjustments of a normal, recurring nature that are necessary for a fair presentation of the financial information contained in those statements. Our historical results are not necessarily indicative of the results that may be expected in the future. The following quarterly financial data should be read in conjunction with our audited consolidated financial statements included in this prospectus.
Quarterly Results
| Three Months Ended | ||||||||||||||||||||||||||||
| Mar. 31, 2015 |
June 30, 2015 |
Sep. 30, 2015 |
Dec. 31, 2015 |
Mar. 31, 2016 |
June 30, 2016 |
Sep. 30, 2016 |
||||||||||||||||||||||
| (in thousands) | ||||||||||||||||||||||||||||
| Revenue |
$ | 28,831 | $ | 55,164 | $ | 57,610 | $ | 45,733 | $ | 41,636 | $ | 77,714 | $ | 81,064 | ||||||||||||||
| Cost of revenue(1) |
27,962 | 37,346 | 38,166 | 35,018 | 38,505 | 50,303 | 50,147 | |||||||||||||||||||||
|
|
|
|
|
|
|
|
|
|
|
|
|
|
|
|||||||||||||||
| Gross profit |
869 | 17,818 | 19,444 | 10,715 | 3,131 | 27,411 | 30,917 | |||||||||||||||||||||
|
|
|
|
|
|
|
|
|
|
|
|
|
|
|
|||||||||||||||
| Operating expenses: |
||||||||||||||||||||||||||||
| Technology and development(1) |
5,770 | 7,150 | 7,463 | 7,459 | 7,898 | 8,060 | 9,781 | |||||||||||||||||||||
| Marketing(1) |
7,210 | 4,075 | 3,726 | 4,888 | 9,211 | 8,486 | 5,436 | |||||||||||||||||||||
| General and administrative(1) |
8,344 | 7,219 | 8,674 | 7,157 | 10,385 | 9,526 | 10,037 | |||||||||||||||||||||
|
|
|
|
|
|
|
|
|
|
|
|
|
|
|
|||||||||||||||
| Total operating expenses |
21,324 | 18,444 | 19,863 | 19,504 | 27,494 | 26,072 | 25,254 | |||||||||||||||||||||
|
|
|
|
|
|
|
|
|
|
|
|
|
|
|
|||||||||||||||
| Income (loss) from operations |
(20,455 | ) | (626 | ) | (419 | ) | (8,789 | ) | (24,363 | ) | 1,339 | 5,663 | ||||||||||||||||
|
|
|
|
|
|
|
|
|
|
|
|
|
|
|
|||||||||||||||
| Total interest income and other income, net |
14 | 10 | 11 | 18 | 84 | 49 | 37 | |||||||||||||||||||||
| Income (loss) before tax benefit (expense) |
(20,441 | ) | (616 | ) | (408 | ) | (8,771 | ) | (24,279 | ) | 1,388 | 5,700 | ||||||||||||||||
|
|
|
|
|
|
|
|
|
|
|
|
|
|
|
|||||||||||||||
| Net income (loss) |
$ | (20,441 | ) | $ | (616 | ) | $ | (408 | ) | $ | (8,771 | ) | $ | (24,279 | ) | $ | 1,388 | $ | 5,700 | |||||||||
|
|
|
|
|
|
|
|
|
|
|
|
|
|
|
|||||||||||||||
| (1) | Includes stock-based compensation as follows: |
| Three Months Ended | ||||||||||||||||||||||||||||
| Mar. 31, 2015 |
June 30, 2015 |
Sep. 30, 2015 |
Dec. 31, 2015 |
Mar. 31, 2016 |
June 30, 2016 |
Sep. 30, 2016 |
||||||||||||||||||||||
| (in thousands) | ||||||||||||||||||||||||||||
| Cost of revenue |
$ | 291 | $ | 346 | $ | 348 | $ | 455 | $ | 518 | $ | 525 | $ | 546 | ||||||||||||||
| Technology and development |
248 | 382 | 341 | 404 | 539 | 559 | 555 | |||||||||||||||||||||
| Marketing |
93 | 39 | 76 | 90 | 110 | 112 | 114 | |||||||||||||||||||||
| General and administrative |
357 | 385 | 1,139 | 568 | 654 | 718 | 940 | |||||||||||||||||||||
|
|
|
|
|
|
|
|
|
|
|
|
|
|
|
|||||||||||||||
| Total |
$ | 989 | $ | 1,152 | $ | 1,904 | $ | 1,517 | $ | 1,821 | $ | 1,914 | $ | 2,155 | ||||||||||||||
|
|
|
|
|
|
|
|
|
|
|
|
|
|
|
|||||||||||||||
66
| Three Months Ended | ||||||||||||||||||||||||||||
| Mar. 31, 2015 |
June 30, 2015 |
Sep. 30, 2015 |
Dec. 31, 2015 |
Mar. 31, 2016 |
June 30, 2016 |
Sep. 30, 2016 |
||||||||||||||||||||||
| (as a percentage of revenue) | ||||||||||||||||||||||||||||
| Revenue |
100.0 | % | 100.0 | % | 100.0 | % | 100.0 | % | 100.0 | % | 100.0 | % | 100.0 | % | ||||||||||||||
| Cost of revenue(1) |
97.0 | 67.7 | 66.2 | 76.6 | 92.5 | 64.7 | 61.9 | |||||||||||||||||||||
|
|
|
|
|
|
|
|
|
|
|
|
|
|
|
|||||||||||||||
| Gross profit |
3.0 | 32.3 | 33.8 | 23.4 | 7.5 | 35.3 | 38.1 | |||||||||||||||||||||
|
|
|
|
|
|
|
|
|
|
|
|
|
|
|
|||||||||||||||
| Operating expenses: |
||||||||||||||||||||||||||||
| Technology and development(1) |
20.0 | 13.0 | 13.0 | 16.3 | 19.0 | 10.4 | 12.1 | |||||||||||||||||||||
| Marketing(1) |
25.0 | 7.4 | 6.5 | 10.7 | 22.1 | 10.9 | 6.7 | |||||||||||||||||||||
| General and administrative(1) |
28.9 | 13.1 | 15.1 | 15.6 | 24.9 | 12.3 | 12.4 | |||||||||||||||||||||
|
|
|
|
|
|
|
|
|
|
|
|
|
|
|
|||||||||||||||
| Total operating expenses |
74.0 | 33.4 | 34.5 | 42.6 | 66.0 | 33.5 | 31.2 | |||||||||||||||||||||
|
|
|
|
|
|
|
|
|
|
|
|
|
|
|
|||||||||||||||
| Income (loss) from operations |
(70.9 | ) | (1.1 | ) | (0.7 | ) | (19.2 | ) | (58.5 | ) | 1.7 | 7.0 | ||||||||||||||||
|
|
|
|
|
|
|
|
|
|
|
|
|
|
|
|||||||||||||||
| Total interest income and other income, net |
— | — | — | — | 0.2 | 0.1 | — | |||||||||||||||||||||
| Income (loss) before tax benefit (expense) |
(70.9 | ) | (1.1 | ) | (0.7 | ) | (19.2 | ) | (58.3 | ) | 1.8 | 7.0 | ||||||||||||||||
|
|
|
|
|
|
|
|
|
|
|
|
|
|
|
|||||||||||||||
| Net income (loss) |
(70.9 | )% | (1.1 | )% | (0.7 | )% | (19.2 | )% | (58.3 | )% | 1.8 | % | 7.0 | % | ||||||||||||||
|
|
|
|
|
|
|
|
|
|
|
|
|
|
|
|||||||||||||||
| (1) | Includes stock-based compensation as follows: |
| Three Months Ended | ||||||||||||||||||||||||||||
| Mar. 31, 2015 |
June 30, 2015 |
Sep. 30, 2015 |
Dec. 31, 2015 |
Mar. 31, 2016 |
June 30, 2016 |
Sep. 30, 2016 |
||||||||||||||||||||||
| (as a percentage of revenue) | ||||||||||||||||||||||||||||
| Cost of revenue |
1.0 | % | 0.6 | % | 0.6 | % | 1.0 | % | 1.2 | % | 0.7 | % | 0.7 | % | ||||||||||||||
| Technology and development |
0.9 | 0.7 | 0.6 | 0.9 | 1.3 | 0.7 | 0.7 | |||||||||||||||||||||
| Marketing |
0.3 | 0.1 | 0.1 | 0.2 | 0.3 | 0.1 | 0.1 | |||||||||||||||||||||
| General and administrative |
1.2 | 0.7 | 2.0 | 1.2 | 1.6 | 0.9 | 1.2 | |||||||||||||||||||||
|
|
|
|
|
|
|
|
|
|
|
|
|
|
|
|||||||||||||||
| Total |
3.4 | % | 2.1 | % | 3.3 | % | 3.3 | % | 4.4 | % | 2.5 | % | 2.7 | % | ||||||||||||||
|
|
|
|
|
|
|
|
|
|
|
|
|
|
|
|||||||||||||||
Revenue for the periods above has followed a seasonal pattern consistent with the residential real estate industry. Accordingly, revenue in 2015 and 2016 increased sequentially from the first quarter through the third quarter. Revenue in the fourth quarter ended December 31, 2015, declined sequentially.
Cost of revenue has also reflected seasonality. Cost of revenue in 2015 and 2016 increased sequentially from the first quarter through the second quarter. In the third quarter of 2015, cost of revenue increased sequentially, while it decreased sequentially in the same period for 2016 as we kept the average number of lead agents flat with the second quarter.
Technology expenses are not seasonal and are influenced period to period by the timing of development project expenses including the additional use of contract software developers. Other than a less than 1% decline from third quarter of 2015 to the fourth quarter of 2015, technology and development expenses increased sequentially in each quarter.
Marketing expenses are influenced by seasonal factors and the timing of advertising campaigns. We typically spend more on advertising during the first half of the year than the second half of the year.
67
Quarterly Key Business Metrics
| Three Months Ended | ||||||||||||||||||||||||||||
| Mar. 31, 2015 |
June 30, 2015 |
Sep. 30, 2015 |
Dec. 31, 2015 |
Mar. 31, 2016 |
June 30, 2016 |
Sep. 30, 2016 |
||||||||||||||||||||||
| Monthly average visitors (in thousands) |
10,235 | 12,381 | 13,060 | 11,142 | 13,987 | 17,021 | 17,795 | |||||||||||||||||||||
| Real estate transactions: |
||||||||||||||||||||||||||||
| Brokerage |
2,958 | 5,465 | 5,653 | 4,510 | 4,005 | 7,497 | 7,934 | |||||||||||||||||||||
| Partner |
1,459 | 2,456 | 2,718 | 2,273 | 1,936 | 2,602 | 2,663 | |||||||||||||||||||||
|
|
|
|
|
|
|
|
|
|
|
|
|
|
|
|||||||||||||||
| Total |
4,417 | 7,921 | 8,371 | 6,783 | 5,941 | 10,099 | 10,597 | |||||||||||||||||||||
|
|
|
|
|
|
|
|
|
|
|
|
|
|
|
|||||||||||||||
| Real estate revenue per real estate transaction: |
||||||||||||||||||||||||||||
| Brokerage |
$ | 8,880 | $ | 9,243 | $ | 9,343 | $ | 9,242 | $ | 9,485 | $ | 9,524 | $ | 9,333 | ||||||||||||||
| Partner |
959 | 1,164 | 1,191 | 1,177 | 1,224 | 1,633 | 1,932 | |||||||||||||||||||||
| Aggregate |
6,263 | 6,738 | 6,696 | 6,539 | 6,793 | 7,491 | 7,474 | |||||||||||||||||||||
| Aggregate home value of real estate transactions (in millions) |
1,874 | 3,601 | 3,837 | 2,984 | 2,599 | 4,684 | 4,898 | |||||||||||||||||||||
| U.S. market share by value |
0.38 | % | 0.44 | % | 0.46 | % | 0.46 | % | 0.48 | % | 0.53 | % | 0.57 | % | ||||||||||||||
| Revenue from top-10 Redfin markets as a percentage of real estate revenue |
75 | % | 77 | % | 76 | % | 73 | % | 71 | % | 73 | % | 72 | % | ||||||||||||||
| Average number of lead agents |
509 | 568 | 621 | 667 | 743 | 756 | 756 | |||||||||||||||||||||
Similar to our revenue, monthly average visitors to our website and mobile application has typically followed a seasonal pattern, increasing sequentially in 2015 and 2016 from the first quarter through the third quarter. Monthly average visitors fell sequentially during the fourth quarter of 2015 following seasonality.
Liquidity and Capital Resources
To date, our principal sources of liquidity have been the net proceeds we received through private sales of our equity securities. From our inception through September 30, 2016, we completed several rounds of sales of shares of our redeemable convertible preferred stock to investors representing total gross proceeds of approximately $167.5 million.
Cash Flows
The following table summarizes our cash flows for the periods indicated:
| Year Ended December 31, |
Nine Months Ended September 30, |
|||||||||||||||
| 2014 | 2015 | 2015 | 2016 | |||||||||||||
| (in thousands) | ||||||||||||||||
| Net cash used in operating activities |
$ | (13,596 | ) | $ | (22,160 | ) | $ | (11,724 | ) | $ | (6,523 | ) | ||||
| Net cash used in investing activities |
(9,039 | ) | (4,567 | ) | (4,133 | ) | (5,116 | ) | ||||||||
| Net cash provided by financing activities |
69,585 | 1,723 | 1,549 | 1,069 | ||||||||||||
Cash Flows from Operating Activities
Net cash used in operating activities in the nine months ended September 30, 2016, consisted of $17.2 million of net losses, a $10.4 million positive impact from non-cash items, a $8.9 million net increase in accrued expenses and accounts payable due to the timing of when amounts came due, and a $2.8 million decrease in prepaid expenses. These benefits were partially offset by a $6.0 million increase in other long-term assets, including a $5.4 million deposit with the landlord for a future lease. We also incurred a $5.4 million increase in accrued revenue due to the timing of real estate transactions that closed.
68
Net cash used in operating activities in the nine months ended September 30, 2015 consisted of $21.5 million of net losses, $7.1 million of non-cash items, and a $4.9 million net increase in accrued expenses due to the timing of when amounts came due. These benefits were partially offset by a $2.3 million increase in accrued revenue due to the timing of real estate transactions that closed.
Net cash used in operating activities in 2015 consisted of $30.2 million of net losses, a $10.0 million positive impact from non-cash items, and a $3.9 million increase in accrued expenses due to the timing of when amounts came due. These benefits were partially offset by a $4.0 million increase in prepaid expenses and a $2.7 million increase in accrued revenue due to the timing of real estate transactions that had closed.
Net cash used in operating activities in 2014 consisted of $24.7 million of net losses, a $7.6 million impact of non-cash items, a $3.4 million increase in accrued expenses due to the timing of when amounts came due, and a $0.5 million decrease in accrued revenue due to the timing of real estate transactions that closed. These benefits were partially offset by a $0.7 million increase in prepaid expenses.
Cash Flows from Investing Activities
Net cash used in investing activities in the nine months ended September 30, 2016 consisted of $5.1 million of fixed asset purchases, including capitalized software development expenses. Net cash used in investing activities in the nine months ended September 30, 2015 consisted of $4.1 million of fixed asset purchases, including internal use software development.
Net cash used in investing activities in 2015 consisted of $4.6 million of purchases of fixed assets, including internal use software development.
Net cash used in investing activities in 2014 consisted of $5.0 million of purchases of fixed assets, including internal use software development and $4.1 million for the acquisition of Walk Score, Inc.
Cash Flows from Financing Activities
Net cash provided by financing activities in the nine months ended September 30, 2016 consisted of $1.1 million in proceeds from the exercise of stock options. Net cash provided by financing activities in the nine months ended September 30, 2015 consisted of $1.6 million in proceeds from the exercise of stock options.
Net cash provided by financing activities in 2015 consisted of $1.7 million from proceeds from the exercise of stock options. Net cash provided by financing activities in 2014 consisted of $68.6 million in net proceeds from the issuance of our redeemable convertible preferred stock, and $1.0 million in proceeds from the exercise of stock options.
69
Contractual Obligations
Contractual obligations are cash amounts that we are obligated to pay as part of certain contracts that we have entered into during the normal course of business. Below is a table that shows the contractual obligations as of December 31, 2015:
| Payments Due by Period: | ||||||||||||||||||||
| Total | Less than 1 Year |
1-3 Years |
3-5 Years |
More Than 5 Years |
||||||||||||||||
| Operating leases |
$ | 11,085 | 4,245 | $ | 5,578 | $ | 1,262 | $ | — | |||||||||||
| Purchase obligations |
2,393 | 1,651 | 742 | — | — | |||||||||||||||
|
|
|
|
|
|
|
|
|
|
|
|||||||||||
| Total |
$ | 13,478 | $ | 5,896 | $ | 6,320 | $ | 1,262 | $ | — | ||||||||||
|
|
|
|
|
|
|
|
|
|
|
|||||||||||
In May 2016, we entered into a lease for a new corporate headquarters in Seattle, Washington. The minimum lease payments total $43.8 million, which will be due over 133 months, beginning in mid-2017 and lasting through 2027.
Our purchase obligations primarily relate to the noncancelable portion of commitments related to our network infrastructure and annual employee meeting. We do not include obligations under contracts that we can cancel without significant penalty in the table above.
Critical Accounting Policies and Estimates
Discussion and analysis of our financial condition and results of operations are based on our financial statements which have been prepared in accordance with GAAP. The preparation of these financial statements requires us to make estimates and judgments that affect the reported amounts of assets and liabilities and related disclosure of contingent assets and liabilities, revenue and expenses at the date of the financial statements. Generally, we base our estimates on historical experience and on various other assumptions in accordance with GAAP that we believe to be reasonable under the circumstances. Actual results may differ from these estimates under different assumptions or conditions.
Critical accounting policies and estimates are those that we consider the most important to the portrayal of our financial condition and results of operations because they require our most difficult, subjective or complex judgments, often as a result of the need to make estimates about the effect of matters that are inherently uncertain. Our critical accounting policies and estimates include those related to revenue recognition and stock-based compensation.
Revenue Recognition
Revenue primarily consists of commissions and fees charged on each real estate transaction completed by us or our partner agents. We recognize commission-based revenue upon closing of a real estate transaction, net of any commission refund, closing-cost adjustment, commission discount or transaction fee adjustment. Commission revenue earned but not received is recorded as accrued revenue on the accompanying consolidated balance sheets. Fees and revenue from other services are recognized when the service is provided.
Stock-based Compensation
Stock-based compensation is measured at the grant date based on the fair value of the award and is recognized as expense, net of estimated forfeitures, over the requisite service period, which is generally the vesting period of the respective award.
70
Determining the fair value of stock-based awards at the grant date requires judgment. We use the Black-Scholes-Merton option-pricing model to determine the fair value of stock options, the output of which is affected by a number of variables. These variables include the fair value of our common stock, our expected common stock price volatility over the expected life of the options, expected term of the stock option, risk-free interest rates and expected dividends, which are estimated as follows:
| • | Fair Value of Our Common Stock. The fair value of the shares of our common stock underlying stock options has historically been established by our board of directors with the assistance of an independent third-party valuation firm. Because there has been no public market for our common stock, our board of directors has relied upon this independent valuation and other factors to establish the fair value of our common stock at the time of grant of the option. |
| • | Expected Life. The expected term was estimated using the simplified method allowed under SEC guidance. |
| • | Volatility. The expected stock price volatility for our common stock was estimated by taking the average historical price volatility for industry peers based on daily price observations. Industry peers consist of several public companies in the real estate brokerage and technology industries. In 2015, we changed the group of industry peers due to external mergers and acquisitions in the real estate industry. |
| • | Risk-Free Rate. The risk-free interest rate is based on the yields of U.S. Treasury securities with maturities similar to the expected term of the options for each option group. |
| • | Dividend Yield. We have never declared or paid any cash dividends and do not presently plan to pay cash dividends in the foreseeable future. Consequently, we used an expected dividend yield of zero. |
In addition to the assumptions used in the Black-Scholes-Merton option pricing model, we must also estimate a forfeiture rate to calculate the stock-based compensation for awards. We applied an estimated forfeiture rate that was derived from historical employee termination behavior. If the actual number of forfeitures differs from these estimates, additional adjustments to compensation expense will be required in future periods.
Valuation of Common Stock
Given the absence of a public trading market of our common stock, and in accordance with the American Institute of Certified Public Accountants Practice Guide, Valuation of Privately Held Company Equity Securities Issued as Compensation, our board of directors exercised reasonable judgment and considered numerous and subjective factors to determine the best estimate of fair value of our common stock, including the following:
| • | contemporaneous unrelated third-party valuations of our common stock; |
| • | the prices at which we sold shares of our redeemable convertible preferred stock to outside investors in arms-length transactions; |
| • | the rights, preferences and privileges of our redeemable convertible preferred stock relative to those of our common stock; |
| • | our results of operations, financial position and capital resources; |
| • | current business conditions and projections; |
71
| • | the lack of marketability of our common stock; |
| • | the hiring of key personnel and the experience of our management; |
| • | the fact that the option grants involve illiquid securities in a private company; |
| • | the likelihood of achieving a liquidity event, such as an initial public offering or a sale of our company, given the prevailing market conditions; |
| • | industry trends and competitive environment; |
| • | trends in U.S. residential real estate market; and |
| • | overall economic indicators, including gross domestic product, employment, inflation and interest rates. |
We performed valuations of our common stock that took into account the factors described above and used a combination of valuation methods as deemed appropriate under the circumstances applicable at the valuation date to determine our business enterprise value, or BEV, including the following approaches:
| • | The market approach estimates value based on a comparison of the subject company to comparable public companies in a similar line of business. To determine our peer group of companies, we considered a combination of public enterprises using Internet-based technology and incurring similar costs to deliver services and selected those that are similar in business operations, products, size, growth, financial performance, and geographic location. From the comparable companies, a representative market value multiple is determined which is applied to the subject company’s operating results to estimate the value of the subject company. The market value multiple was determined based on consideration of revenue multiples and earnings before interest, taxes, depreciation and amortization, or EBITDA, and gross margin to each of the companies’ last 12-month revenue and the next fiscal year 12-month revenue. The multiples are calculated and then applied to the business being valued. The estimated value is then discounted by a non-marketability factor (discount for lack of marketability) due to the fact that stockholders of private companies do not have access to trading markets similar to those enjoyed by stockholders of public companies, which affects liquidity. |
| • | The income approach estimates value based on the expectation of future cash flows that a company will generate over a discrete projection period, as well as for the terminal period. The projected free cash flows includes earnings before interest and taxes, less taxes, plus depreciation and amortization, less capital expenditures plus and increase or decrease in working capital. These future cash flows are discounted to their present values using a discount rate derived from an analysis of the cost of capital of comparable publicly traded companies in similar lines of business as of each calculations date and is adjusted to reflect the risks inherent in our cash flows. In addition, we also consider an appropriate discount adjustment to recognize the lack of marketability due to being a private company. |
| • | The prior sale of company stock approach estimates value by considering any prior arms’ length sales of our equity. When considering prior sales of our equity, the valuation considers the size of the equity sale, the relationship of the parties involved in the transaction, the timing of the equity sale, and our financial condition at the time of the sale. |
72
Once the equity value is determined, one of the following methods was used to allocate the BEV to each of our classes of stock: (1) the option pricing method, or OPM; (2) a probability weighted expected return method, or PWERM; (3) the current value method, or CVM; or (4) the Hybrid Method, which is a hybrid between the OPM, PWERM or CVM methods.
The OPM treats common stock and preferred stock as call options on a business, with exercise prices based on the liquidation preference of the preferred stock. Therefore, the common stock only has value if the funds available for distribution to the holders of common stock exceeds the value of the liquidation preference of the preferred stock at the time of a liquidity event, such as a merger, sale, or initial public offering, assuming the business has funds available to make a liquidation preference meaningful and collectible by stockholders. The common stock is modeled as a call option with a claim on the business at an exercise price equal to the remaining value immediately after the preferred stock is liquidated. The OPM uses the Black-Scholes-Merton option pricing model to price the call option.
The PWERM approach employs various market approach calculations depending upon the likelihood of various liquidation scenarios. For each of the various scenarios, an equity value is estimated and the rights and preferences for each stockholder class are considered to allocate the equity value to common shares. The common share value is then multiplied by a discount factor reflecting the calculated discount rate and the timing of the event. Lastly, the common share value is multiplied by an estimated probability for each scenario. The probability and timing of each scenario are based upon discussions between our board of directors and our management team. Under the PWERM, the value of our common stock is based upon possible future exit events for our company.
The CVM approach allocates the enterprise value derived from one or more of the approaches described above to the various series of a company’s preferred stock based on their respective liquidation preferences or conversion values, in accordance with the terms of the prevailing Articles of Incorporation, assuming that each class of stock takes the course of action that maximizes its return. The fundamental assumption of this method is that the manner in which each class of preferred stockholders will exercise its rights and achieve its return is determined based on the enterprise value as of the valuation date and not at some future date. Accordingly, depending upon the equity value and the nature and amount of the various liquidation preferences, preferred stockholders will participate in equity value allocation either as holders of preferred stock or, if conversion would provide them with better economic results, as holders of common stock. We utilized CVM to account for certain secondary transactions involving our common stock. Specifically, we considered pricing, investor participation, visibility of information between the parties and the purpose and size of the transaction.
Following this offering, we will rely on the closing price of our common stock as reported by on the date of grant to determine the fair value of our common stock.
Income Taxes
Income taxes are accounted for using an asset and liability approach that requires the recognition of deferred tax assets and liabilities for the expected future tax consequences of temporary differences between the consolidated financial statement and tax bases of assets and liabilities at the applicable enacted tax rates. We will establish a valuation allowance for deferred tax assets if it is more likely than not that these items will either expire before we are able to realize their benefit or that future deductibility is uncertain.
We believe that it is currently more likely than not that our deferred tax assets will not be realized and as such, we have recorded a full valuation allowance for these assets of $31.5 million. We evaluate the likelihood of the ability to realize deferred tax assets in future periods on a quarterly basis,
73
and when appropriate evidence indicates we would release our valuation allowance accordingly. The determination to provide a valuation allowance is dependent upon the assessment of whether it is more likely than not that sufficient taxable income will be generated to utilize the deferred tax assets. Based on the weight of the available evidence, which includes our historical operating losses, lack of taxable income, and accumulated deficit, we provided a full valuation allowance against the U.S. tax assets resulting from the tax loss and credits carried forward
In addition, current tax laws impose substantial restrictions on the utilization of research and development credit and net operating loss carryforwards in the event of an ownership change, as defined by the Internal Revenue Code Section 382 and 383. Such an event, having occurred in the past or in the future, may significantly limit our ability to utilize its net operating losses and research and development tax credit carryforwards.
Off-Balance Sheet Arrangements
Since inception, we have not had any relationships with unconsolidated entities or financial partnerships, such as entities often referred to as structured finance or special purpose entities, which would have been established for facilitating off-balance sheet arrangements or for another contractually narrow or limited purpose.
JOBS Act
We are an “emerging growth company,” as defined in the Jumpstart Our Business Startups Act, or JOBS Act. Under the JOBS Act, emerging growth companies can delay adopting new or revised accounting standards issued subsequent to the enactment of the JOBS Act until such time as those standards apply to private companies. We have irrevocably elected not to avail ourselves of this exemption from new or revised accounting standards, and, therefore, will be subject to the same new or revised accounting standards as other public companies that are not emerging growth companies.
Quantitative and Qualitative Disclosures about Market Risk
The principal market risk we face is interest rate risk. We had cash and cash equivalents of $85.6 million as of December 31, 2015 and $75.0 million as of September 30, 2016. The goals of our investment policy are liquidity and capital preservation. We do not enter into investments for trading or speculative purposes. Our investment policy allows us to maintain a portfolio of cash equivalents and investments in a variety of securities, including U.S. government treasury and agency issues, bank certificates of deposit that are 100% Federal Deposit Insurance Corporation insured, and SEC-registered money market funds that consist of a minimum of $1 billion in assets and meet the above requirements. We believe that we do not have any material exposure to changes in the fair value of these assets as a result of changes in interest rates due to the short term nature of our cash, cash equivalents and short-term investments. Declines in interest rates, however, would reduce future investment income. A 100 basis-point decline in interest rates, occurring January 1, 2015 and sustained throughout the fourth quarter of 2015, would not have been material.
We do not currently have any operations outside of the United States, and as a result, we do not face significant risk with respect to foreign currency exchange rates.
Recent Accounting Standards
For information on recent accounting standards, see Note 1 to our consolidated financial statements included elsewhere in this prospectus.
74
Overview
Redfin is a technology-powered residential real estate brokerage. We represent people buying and selling homes in over 80 markets throughout the United States. Our mission is to redefine real estate in the consumer’s favor.
Our strategy is simple. In a commission-driven industry, we put the customer first. We do this by pairing our own agents with our own technology to create a service that is faster, better, and costs less. We meet customers through our listings-search website and mobile application, reducing the marketing costs that can keep fees high. We let homebuyers schedule home tours with a few taps of a mobile-phone button, so it’s easy to try our service. We create an immersive online experience for every Redfin-listed home and then promote that listing to more buyers than any traditional brokerage can reach through its own website. We use machine learning to recommend listings better than any customer could find on her own. And we pay Redfin lead agents based in part on customer satisfaction, not just commission, so we’re on the customer’s side.
Our efficiency results in savings that we share with our customers. Our homebuyers saved on average approximately $3,500 per transaction in 2016. And we charge most home sellers a commission of 1% to 1.5%, compared to the 2.5% to 3% typically charged by traditional brokerages.
The results of our customer-first approach are clear. We:
| • | helped customers buy or sell more than 75,000 homes worth more than $40 billion; |
| • | gained market share in 81 of our 84 markets from 2015 to 2016; |
| • | drew more than 15 million monthly average visitors to our website and mobile application in 2016, 39% more than in 2015, making us the fastest-growing top-10 real estate website; |
| • | earned a Net Promoter Score, a measure of customer satisfaction, that is 61% higher than competing brokerages’, and a customer repeat rate that is 37% higher than competing brokerages’; |
| • | sold Redfin-listed homes for approximately $3,000 more on average compared to the list price than competing brokerages’ listings in 2016; and |
| • | employed lead agents who, in 2016, were on average three times more productive, and earned on average twice as much money as agents at competing brokerages; our lead agents were also 44% more likely to stay with us from 2015 to 2016 than agents at competing brokerages. |
And we’re just getting started. Because we’re one of the only major brokerages building virtually all of our own brokerage software, our gains in efficiency, speed, and quality are proprietary. Because our leadership and engineering teams have come from the technology industry, and have structured the business to invest in software development, we believe those software-driven gains are likely to grow over time. And finally, because we hire our own lead agents as employees, we can set data-driven best practices for selling homes, with our software tailored to those practices, creating a positive feedback loop between software and operational innovations that we believe differentiates us
75
from traditional brokerages. Moreover, we believe listing more homes and drawing more homebuyers to our website and mobile application will let us pair homebuyers and home sellers directly online over time, further improving our service and lowering our costs.
Our growth has been significant. For the years ended December 31, 2014 and 2015, we generated revenue of $125.4 million and $187.3 million, respectively, representing annual growth of 37% and 49%, respectively. For the nine months ended September 30, 2015 and 2016, we generated revenue of $141.6 million and $200.4 million, respectively, representing year-over-year growth of 42%. We generated net losses of $24.7 million and $30.2 million for the years ended December 31, 2014 and 2015, respectively, and $21.5 million and $17.2 million for the nine months ended September 30, 2015 and 2016, respectively.
Real Estate Industry
In 2016, housing represented more than 25% of total investment dollars in the United States. NAR estimated that the aggregate value of existing U.S. home sales was approximately $1.5 trillion in 2016 from approximately 5.5 million total transactions. We estimate consumers paid more than $75 billion in commissions in 2016 for these transactions.
Highly Fragmented
The residential brokerage industry is highly fragmented. There are an estimated 2,000,000 active licensed agents and over 86,000 real estate brokerages in the United States, many operating through franchises or as small local brokerages. Traditional brokerages engage agents as independent contractors. This model limits these brokerages’ ability to tell agents how much to charge, what technology to use, and how to treat customers. And most residential brokerages buy disparate technologies rather than build their own.
Our goal is to build the first large-scale brokerage that stands apart in consumers’ minds for delivering a unique and consistent customer experience, where the value is in our brokerage and its technologies, not just a personal relationship with one agent.
Commission-Driven Compensation
Traditional real estate agents earn commissions based on a home’s sale price, with no direct consideration for customer satisfaction or service quality.
We pay our lead agents a bonus based in part on customer satisfaction, not just commission. We do this to make our lead agents accountable not just for any sale, but for a sale on terms that satisfy our customer. We believe this supports a more trusting relationship between our customers and our lead agents, giving customers the space to make better decisions, and the confidence to rely on our advice.
High Customer-Acquisition Costs
U.S. worker productivity has increased approximately 37% since 1999, but real estate agent productivity has fallen nearly 31% on average over the same period, in part because of increases in the number of real estate agents, which leads to more competition to find customers. Traditional real estate agents spend significant amounts of time and money prospecting for customers through traditional advertising channels and networking activities.
We believe that the Internet is more efficient at connecting consumers with agents and that this efficiency gain can benefit the consumer most when a website is operated by the brokerage representing that consumer in a purchase or sale.
76
Market Trends
We believe the following trends show that consumers prefer a technology-powered real estate brokerage like Redfin.
A Changing Consumer
Residential real estate consumers increasingly want fast service and low fees. Since 2011, the percentage of Redfin home-tour requests received with less than 24 hours’ notice increased from 39% to 51%. According to a study we commissioned, 57% of people who successfully sold a home in 2016 asked their agent for a lower commission.
More Consumers Go Online to Find and Purchase Homes and Select Agents
Homebuyers increasingly go online to find homes for sale. According to a 2016 study by NAR, more than half of homebuyers found their home online and 86% identified websites as the most useful information source. According to a 2016 study we commissioned, one in five homebuyers made an offer on a home they had not seen in person.
Consumers also choose their agent online. While 33% of homebuyers find an agent through referrals, nearly that many, 26%, are finding an agent online.
Shift to Mobile
Mobile devices are increasingly popular in the homebuying process. According to a 2016 NAR survey, 72% of homebuyers in 2015 used a mobile device to find their home, up from 61% in 2014 and 45% in 2013. The same study found that 58% of homebuyers found the home they purchased from browsing on a mobile application.
New Technologies Emerging
In a 2016 NAR survey, 48% of respondents from various residential brokerages indicated that “keeping up with technology” would be their biggest challenge over the next two years. Forty-six percent saw competition from online firms increasing, and 43% expected competition from non-traditional firms to increase in the next year.
How We Win
Next-Generation Technologies
From stocks to books to lodging, technology has made it easier, faster, and less expensive to buy almost everything in our lives except the most important thing: our home.
To solve this problem, Redfin uses a wide range of next-generation technologies. We invented map-based real estate search. We use machine learning and artificial intelligence to answer customers’ most important questions about where to live, how much a home is worth, and when to move. We draw on cloud computing to perform computationally intensive comparisons of homes at a scale that would otherwise be cost prohibitive. We use streaming technologies to quickly notify customers about a listing. And we embrace new hardware, such as three-dimensional scanning cameras that let potential homebuyers walk through the property online.
The goal of all of these technologies is to empower our customers and increase our agents’ productivity. This leads to consistently better customer service at a lower cost. We pass the resulting savings to our customers.
77
Comprehensive Listings Data
As a brokerage, Redfin has complete access to all the homes listed for sale in the local multiple listing services, or MLSs, in the markets we serve. MLSs are used by real estate agents to list properties and coordinate sales. Although websites that do not operate a brokerage often have access to these MLSs, the terms of their access vary widely. As a result, brokerage websites often get more listings from MLSs, or more detail about each listing, than other websites.
Access to this extensive data, paired with local knowledge, lets us give our customers what we believe to be the most comprehensive information on homes for sale.
Additionally, our streaming architecture is designed to recommend listings to our customers by mobile alert or email soon after these listings appear in the MLS. These advantages in loading listings data and quickly notifying consumers come not just at the listing debut in the MLS, but in recognizing when a price changes or a home sells. For over 80% of these listings, we can show the listing on our website and mobile application within five minutes of its debut in the MLS.
When we represent home sellers, we capture even more data about their properties, including an interactive three-dimensional scan; and in certain markets, we can also post our own listings to our website and mobile application days before those listings appear on any other website.
In 2016, we were the fastest growing top-10 real estate website. In 2016, we had the most monthly average visitors of any residential brokerage website, with more than twice as many as the second-most popular residential brokerage website. Monthly average visitors to our website and mobile application grew 39% from 2015 to 2016.
Machine Learning
Redfin Listing Recommendations
Knowing which listings customers visit online, tour in person, or ultimately make an offer on lets our algorithms make better listing recommendations, further enhanced through curation by our lead agents. These Redfin listing recommendations are one part of our strategy to increase the revenue generated from online visitors by personalizing our website and our service to keep customers engaged with Redfin from their first visit to a closing.
Redfin Estimate
Our access to detailed data about every MLS listing in markets we serve has helped us build what we believe is the most accurate automated home-valuation tool. According to a 2017 study we commissioned, among industry-leading websites that display valuations for active listings, 64% of the listings for which we provided a public valuation estimate sold within 3% of that estimate, compared to only 29% and 16% of the public estimates for the two other websites in the study. Our proprietary Redfin Estimate is fundamental technology that draws visitors to our website, then entices them to subscribe to a monthly home report with updates on changes to their home’s value. The Redfin Estimate supports our seller’s agents in consultations with homeowners, our buyer’s agents in guiding buyers on what to pay for a home, and our marketing teams in deciding which homeowners to target for a listing consultation.
78
Redfin Hot Homes
This proprietary algorithm identifies the homes we believe are most likely to sell quickly. Coupling Redfin Hot Homes alerts with on-demand tours, as well as data we’re collecting about offer deadlines, is part of our strategy to give our customers a first-mover advantage in pursuing the most desirable homes for sale.
We believe that our approach to data science and machine learning will continue to yield other insights, about the customers most likely to complete a transaction, about the key moments for offering service to online visitors we hope to convert into customers, and even about which homes will be harder or easier to sell, so we can optimize our fees and set customer expectations.
On-Demand Service
Customers place a premium on speed. When we offer online visitors faster service, more try that service. Delivering this speed depends on seamless integration between our technology and service—to get customers into homes first, to prepare an offer first, to be able to win the deal, and to close without a hitch. Tracking every digital customer interaction and working in teams lets us provide fast, consistently high-quality service.
With a few taps of a mobile-phone button, a Redfin homebuyer can schedule home tours quickly. To schedule a tour instantly and automatically, we first show the buyer online a wide range of homes for sale. Once the buyer chooses the homes she wants to see, we review lead agent availability, location, areas of expertise, and past interactions with that buyer, data that is easier for us to track because we store customer interactions with our agents in one central system, and ask our lead agents as employees to work during times of peak demand. Next, we confirm that each home is available to show at the requested time, communicating with the listing agent programmatically or through a phone call.
Finally, we determine the optimal order in which to visit each home, allocating enough time to drive or walk from one to the next. Because on-demand service depends on different lead agents being available at different times, everyone on a local Redfin team can see all of the customer’s online and brokerage activities to learn about the customer prior to the tour. Every team member also can update this system through mobile tools during and after the tour so we can follow up with more detail about a home of interest, different listing recommendations, or an on-the-spot offer. The entire solution depends on a listings search website, a customer database, a team structure, and a mobile capability that few brokerages can deliver.
Teams and Tools
We believe that our ability to deliver better, faster service at lower cost depends not only on our ongoing software development, but also on organizing employees into teams using that software to respond faster than most individual agents could, without stepping on one another’s toes or worrying about poaching the customer from another agent.
Teams of Employee Agents
Our lead agents are responsible for each customer’s success and are the customer’s primary point of contact. A lead agent typically meets the customer on a first tour or listing consultation and works with that customer throughout the buying or selling process. She is assisted by support agents for responding to initial online inquiries, by marketing assistants for getting a home photographed and promoted online and in printed fliers, and by transaction coordinators for closing paperwork.
79
Our entire team of employees follows processes and uses software developed by Redfin to ensure consistent, high-quality service, based on data-driven insights about how to schedule tours, when to check in with customers, and how to price a home.
Flexible Network of Independent Associate Agents
We also contract with independent associate agents to create a flexible network of licensed real estate agents to deliver faster service for customer tours, open houses, and inspections.
Redfin Agent Tools
Because customers use our website and mobile application for their home search, and often go online to schedule tours, ask questions, review traffic to their listing, or start offers, we do not depend, as many competing brokerages do, on agents manually logging every customer interaction. Our proprietary Redfin Agent Tools automatically captures information on millions of customer interactions every year, and provides templates for our lead agents to recommend listings, follow up on tours, prepare comparative market analyses, and write offers. Our employee agents can access Redfin Agent Tools on their mobile device, so we can serve customers better and faster, even when our agents are in the field rather than at their desks. This is why a Redfin team can work together to deliver personal service to a large number of customers, with an agent using the system to learn, for example, that one customer is only interested in homes without stairs and another customer is looking for a home near a bus route.
Productive Agents
Our lead in website traffic among major brokerages has a profound effect not just on our economics but on our culture: our lead agents’ primary responsibility is not selling our services, but advising customers buying and selling homes. In 2016, our lead agents were on average three times more productive and earned on average twice as much money as agents at competing brokerages. High-performing agents also earned stock options and a celebratory trip to Barcelona.
About 60% of our lead agents were previously real estate agents, with the other 40% largely coming to us from customer-service industries like retail or hospitality. Data guides our hiring and management decisions, as we’ve analyzed which industry hires outperform those new to real estate and what level of prior experience is correlated with long tenure at our company. We measure agent performance in detail and give managers access to this data in real time, so we can quickly intervene when our customer service falls short.
Our lead agents were 44% more likely to stay with us from 2015 to 2016 than agents of competing brokerages.
Investment in Agents
The high productivity of our lead agents rationalizes an investment in equipment, management, training, and support staff that is unusual in the industry: we pay for all of our employee agents’ equipment, dues, and marketing expenses, and provide training for each new hire, with a multi-week course for agents in our largest markets. Virtually every lead agent also receives support from transaction coordinators, support staff, marketing assistants, and local management. We believe that the combined effect of these investments is more productive lead agents and better customer service.
Redfin Partner Program
To serve customers when our own agents can’t due to high demand or geographic limitations, we have developed partnerships with over 2,900 agents at other brokerages. Once we refer a
80
customer to a partner agent, that agent, not us, represents the customer from the initial meeting through closing, at which point the agent pays us a portion of her commission as a referral fee. As part of our commitment to low fees, we directly issue the customer a $500 check in connection with the purchase or sale of any home costing more than $200,000.
Rather than countering seasonal and cyclical changes in demand by recruiting a surplus of agents, we rely on partner agents to handle demand swings. We built our partner program so our lead agents can deliver consistently high-quality service at busy times, and so we can limit the effect of fixed expenses when demand falters. Anytime we have more customers than our lead agents can serve well, our website and mobile application refer those customers to our partners.
Each day, our website and mobile application make hundreds of thousands of decisions about whether customers are best served by a lead agent or a partner agent; our managers and executives meet weekly to calibrate this system based on our assessment of customer-satisfaction levels, hiring plans, monthly average visitors, and economic conditions. The data we gather comparing the customer satisfaction and close rates of our lead agents to partner agents also lets us benchmark our service quality from market to market.
Because the Redfin Partner Program is designed to ensure that every customer gets high-quality service, we require each partner agent to have completed at least five sales in the last 12 months, then subject the partner agent to a rigorous online and in-person screening process. We also survey customers who work with our partner agents, removing from the program partner agents who do not maintain high service levels.
Homebuyer Experience
We seek to provide every homebuyer with fast service, low fees, and an agent completely on that buyer’s side. Our lead agents can join each homebuyer’s online search, commenting on the buyer’s favorite listings, answering questions, or recommending listings the buyer might have overlooked. With a few taps of a mobile-phone button, a Redfin homebuyer can schedule home tours before many buyers even realize these homes are for sale. Our lead agent hosting the tour earns bonuses based on customer reviews, not just commissions, encouraging the candor customers need to make the best decision about which home to buy.
We recently introduced an instant-offer capability in selected markets: on the front steps of a listing the customer likes, our lead agent uses our technology to draft an offer from her phone in minutes, with the goal of beating competing homebuyers to the punch. During the inspections and appraisals, we track contracts and tasks in an online deal room to keep the closing on schedule.
Home Seller Experience
We seek to give every home seller honest advice on how to price her property; the best marketing, primarily online; and the lowest fees. Our industry-leading algorithms for calculating what a home is worth lead to a better pricing recommendation in the initial consultation. We believe this is one reason Redfin listings sell for more relative to the list price than other brokers’, and are more likely to sell in the first 90 days on market.
A homeowner can see our lead agents’ nearby sales paired with customer reviews to decide whether we have the local expertise to sell her home. When we prepare a home for sale, we film an interactive, three-dimensional virtual scan of the home that lets potential homebuyers walk through the property online, boosting its appeal to out-of-town buyers.
81
To increase demand, we promote each Redfin listing on our website and mobile application. Our website has more than double the visits of any competing brokerage website. We drive additional demand through targeted email as well as other channels like Facebook, using advanced algorithms to promote the listing to the right homebuyers. We also share the listing with every major real estate website. An online dashboard tracks traffic to the listing and an iPad application registers in-person visits to open houses, so our home sellers make better decisions about pricing, marketing, and offer negotiations.
We believe listing more homes and drawing more homebuyers to our website and mobile application will let us pair homebuyers and home sellers directly online over time, further improving our service and lowering our costs.
Our Value Proposition
Customers Get Better Service
Our Net Promoter Score is 53, compared to the industry average of 33, as measured by a third-party research firm in 2016.
Measurable Results
Redfin listings were on the market for an average of 29 days in 2016 compared to the industry average of 35 days according to a study by a third-party research firm. And over 74% of Redfin listings sold within 90 days versus the industry average of approximately 69% according to the same study.
Customers Save Money
We give homebuyers a portion of the commissions that we earn. We typically earn 2.5% to 3% of a home’s value for representing a homebuyer, and we contributed an average of approximately $3,500 per transaction through a commission refund or a closing-cost reduction in 2016. The commission refund or closing-cost reduction depends on the home’s value and lender approval, and some states prohibit commission refunds altogether.
Consumers selling a home with a traditional brokerage typically pay total commissions of 5% to 6% of the sale price, with 2.5% to 3% going to their agent and another 2.5% to 3% to the agent representing the buyer. Redfin home sellers typically pay only 1% to 1.5% of their home’s sale price to us, depending on the market and subject to market-by-market minimums. So we can readily sell our listings to any homebuyer, including a buyer represented by a competing brokerage, we typically recommend that our home sellers still offer a 2.5% to 3% commission to the buyer’s agent. As a result, we typically save our home sellers 1% to 2% of the total sales prices on average listing fees.
In late 2014, we lowered our home seller commission from 1.5% to 1% in Washington, D.C., Virginia and Maryland. Seeing accelerating share gain in those markets, we rolled out 1% listing fees in Seattle, Chicago and Denver in late 2016.
Our Markets
We operate in 84 markets across 37 states and Washington, D.C. These markets cover approximately 70% of the United States by population. For 2016, we had 0.5% of U.S. market share, representing a 61% increase from 2014 and a 22% increase from 2015. We measure U.S. market share using transaction-volume data from NAR, and we include the value of transactions completed by our partner agents for sales referred from our website and mobile application. As we further realize the benefits of increasing scale, we’ll evaluate new markets to enter.
82
Growth Strategies
Grow Share in Existing Markets
We have a strong track record of gaining share across nearly all of our markets, including the markets open more than a decade. We have studied cohorts of our markets opened in similar time frames. We have gained market share, increased real estate revenue, and increased real estate gross margin in all of the cohorts in each of the years studied. Our year-to-year market share gains have been largely consistent across cohorts.
As we gain local market share, our service gets even better. By doing more transactions in a smaller area, agents increase their local knowledge. We capture more customer-interaction data, powering analytics such as our listing recommendation engine. Potential customers see our yard signs more often and hear from other customers about our service. We believe these factors fuel further market share gains.
We believe listing share lets us provide better online search results, because we post Redfin listings to our website first in many markets, with exclusive photos about each listing. We further believe that as we gain share, more homebuyers will want to work with us to gain access to our listings, and we’ll get more listings from owners seeking access to our buyers. As this flywheel starts turning, we plan to invest more to connect homebuyers and home sellers directly.
We believe transactions from our repeat customers will continue to play a larger role in our market share gains. According to NAR, homeowners sell their homes every nine years on average, suggesting that repeat business takes a long time to build. At Redfin, we’re now seeing our customers come back to sell a home we helped them buy many years before. The rate at which our customers return to us for another transaction is 37% higher than the industry average. With tens of thousands of new customers each year, and higher rates of customer satisfaction, we believe we can drive future share gains as those customers choose to work with us again.
Offer a Complete Solution
We’re planning new services to become an end-to-end solution for customers buying and selling a home. Our experience with Title Forward, our title and settlement business, demonstrates that many Redfin customers are open to buying more services from us. In 2016, in the six states where Title Forward operated, 56% of our homebuyers also chose our title and settlement service. In 2017, we plan to begin originating and underwriting loans through Redfin Mortgage. Our goal is to build technology for Redfin Mortgage that will ultimately support a completely digital closing, leading to efficiency gains for our brokerage, title, and mortgage businesses.
Our Culture of Service and Thrift
Service is fundamental to our “everyone-sweeps-the-floors” culture: our executives serve our employees, and our employees serve our customers. As part of this humility, we recognize that everyone can be a leader. An agent can imagine better software; an engineer can imagine better service. The only way we can use technology to make real estate better is by working together, in a way we believe that few pure technology or pure service companies can.
Another tenet of our culture is thrift. We may be a next-generation real estate brokerage, but we’re old-fashioned about stockholder value. We continued to grow through the darkness of the 2008 real estate crisis as we fought to make a margin-sensitive, headcount-intensive business work with the resources we had. Next week, next year, some day, that darkness will return, and we believe that our formative experiences will make us better prepared for it than others.
83
This has long been known at Redfin as a “rabid squirrel” state of mind. We often remind ourselves that every employee is paid by the sweat of a real estate agent’s brow. It’s the way we always want to be.
Our Employees
As of December 31, 2016, we had a total of 1,845 employees, of which 1,810 were full-time employees. Twenty percent of our total employees were located at our headquarters in Seattle, Washington.
Marketing
Because we serve customers from their first online visit until the closing, we know how much we can afford to spend to meet a customer and which marketing channels provide the best returns on investment. With potential customers sometimes hopping between websites and different individual real estate agents over a year or more during a home search—and as often deciding against a move—it’s easy for an advertiser to lose track of who actually closes.
We analyze billions of interactions from customers and potential customers in our databases. We can pay more for one particular Facebook ad if we have determined that the people who click on it are extremely likely to buy a home. We can remove a marketing campaign from our own website that leads to more consumers contacting our agents, but fewer actual sales. At any given moment, we’re running over a hundred experiments on our website and mobile tools, with many more experiments running on third-party channels, to identify the most effective advertising.
We apply this data-driven approach to decisions about which pages to optimize for search engine traffic, what combination of email messages drives the most sales, and which moments in a TV commercial inspire the strongest consumer response.
The goal of this data-driven approach to marketing is a formula for driving increased customer awareness in a cost-effective manner through both digital and traditional advertising channels:
| • | Search engine optimization. Our engineering teams constantly upgrade our website content and performance so that top-trafficked search engines find and rank our results for properties, neighborhoods and regions. We believe this improves the customer experience and our ranking on high-traffic search engines. |
| • | Targeted-email campaigns. We run targeted-email campaigns to connect with customers. These email campaigns, powered by machine learning, recommend relevant new listings to homebuyers and home sellers at what we believe are key moments throughout their interactions with us. |
| • | Paid-search advertising. We advertise with top-trafficked search engines, regularly adjusting our bidding on key words and phrases, and modifying campaigns based on results. |
| • | Social media marketing. We purchase targeted ads on social media networks such as Facebook and Twitter to generate traffic for our listings and attract new customers. |
| • | Traditional media. We market through a mix of traditional media, including TV, radio, and direct mailings. We’ve been advertising on TV since 2014, and we continue to invest in TV advertising. |
84
Technology Development
We build almost all of our own software, with more than 150 engineers and product managers based in Seattle and San Francisco. The audience for our software includes consumers visiting our website and our mobile application, customers of our brokerage and of Title Forward, as well as our real estate teams, and our partner agents.
Our focus is on software that makes real estate fundamentally more efficient, and we believe our competitive advantage is a deeper understanding of how real estate works, gained by working with our lead agents and transaction coordinators. Lead agents and support teams participate in the development of our brokerage software including for scheduling tours, preparing offers, pricing homes, chatting with customers, and monitoring the closing process.
Our obsession with efficiency extends beyond real estate to our own software development practices. We aim to hire a relatively small number of deeply technical engineers who understand that every expense matters. We have engineers dedicated to building software that makes the rest of our engineers more productive. And we measure the results of every major software project, eliminating features that do not make a difference to our customers or agents so as to avoid maintenance costs over time.
We contract with third-party software developers on a limited basis for specific projects. Our primary website servers operate from a co-location facility in Seattle, Washington, and we use a variety of third-party cloud-based software and services.
For 2014, 2015, and the nine months ended September 30, 2016, technology and development expenses were 14%, 15%, and 13% of revenue, respectively.
Competition
The residential brokerage industry is highly fragmented. There are an estimated 2,000,000 active licensed agents and over 86,000 real estate brokerages in the United States. We face intense competition nationally and in each of the markets we serve. We compete primarily against other residential real estate brokerages, which include franchise operations affiliated with national or local brands, and small independent brokerages. We also compete with a growing number of Internet-based brokerages and others who operate with novel business models. Competition is particularly intense in some of the densely-populated metropolitan markets we serve, as they are dominated by entrenched real estate brokerages with potentially greater financial resources, superior local referral networks, name recognition and perceived local knowledge and expertise. We also compete for traffic against online real estate data websites that aggregate listings and sell advertising to traditional brokers.
Our industry has evolved rapidly in recent years in response to technological advancements, changing customer preferences and new offerings. We expect increasing competition from technology-enabled competitors, including new brokerages with technology-driven business models as well as traditional brokerages that acquire or build businesses or technology to enhance their offerings.
We believe we compete primarily based on:
| • | access to timely, accurate data about homes for sale; |
| • | traffic to our website and mobile application; |
| • | the speed and quality of our service, including agent responsiveness and local knowledge; |
85
| • | our ability to hire and retain agents who deliver the best customer service; |
| • | the costs of delivering our service, and the price of our service to consumers; |
| • | consumer awareness of our service and the effectiveness of our marketing efforts; |
| • | technological innovation; and |
| • | depth and breadth of local referral networks. |
We believe that our customer-focused values and technology differentiate us from our competitors and that we compete favorably with respect to the factors above.
Regulatory Matters
We are subject to a wide variety of laws, rules, and regulations enforced by both governments and private organizations. Many of these rules and regulations are constantly evolving. If we are unable to comply with them, we could be subject to civil and criminal liabilities, revocation or suspension of our licenses or other adverse actions. We may also be required to modify or discontinue some or all of our offerings, and our ability to grow our business and our reputation may be harmed. See “Risk Factors” for a discussion of our regulatory risks.
Brokerage Service Regulation
Brokerage businesses are primarily regulated at the state level by agencies dedicated to real estate matters or professional services.
State Regulation
Real estate brokerage licensing laws vary widely from state to state. Generally all individuals and entities acting as real estate brokers or salespersons must be licensed in each state where they operate. Licensed agents must be affiliated with a broker to engage in licensed real estate brokerage activities. Generally, a corporation must obtain a corporate real estate broker license, although in some states the licenses are personal to individual brokers. The broker in all states must actively supervise the individual licensees and the corporation’s brokerage activities within the state. All licensed market participants, whether individuals or entities, must follow the state’s real estate licensing laws and regulations. These laws and regulations generally detail minimum duties, obligations and standards of conduct, including requirements related to contracts, disclosures, record-keeping, local offices, trust fund handling, agency representation, advertising regulations, and fair housing. In each of the states and Washington, D.C., where our operations so require, we have designated a properly licensed broker and, where required, we also hold a corporate real estate broker’s license.
Federal Regulation
Several federal laws and regulations govern the real estate brokerage business, including federal fair housing laws such as the Real Estate Settlement Procedures Act of 1974, or RESPA, and the Fair Housing Act of 1968.
RESPA restricts kickbacks or referral fees that real estate settlement service providers such as real estate brokers, title and closing service providers, and mortgage lenders may pay or receive in connection with the referral of settlement services. RESPA also requires certain disclosures regarding certain relationships or financial interests among providers of real estate settlement services. RESPA provides a number of exceptions that allow for payments or splits between service providers, including market-rate compensation for services actually provided.
86
RESPA is administered by the Consumer Financial Protection Bureau, or CFPB. The CFPB has applied a strict interpretation of RESPA and related regulations and often enforces these regulations in administrative proceedings. Consequently, industry participants have modified or terminated a variety of business practices to avoid the risk of protracted and costly litigation or regulatory enforcement.
The FHA prohibits discrimination in the purchase or sale of homes. The FHA applies to real estate agents and mortgage lenders, among others. The FHA prohibits expressing any preference or discrimination based on race, religion, sex, handicap, and certain other protected characteristics. The FHA also applies broadly to many forms of advertising and communications, including MLS listings and insights about home listings.
Local Regulation
In additional to state and federal regulations, residential transactions may also be subject to local regulations. These local regulations generally require additional disclosures by parties or agents in a residential real estate transaction, or the receipt of reports or certifications, often from the local governmental authority, prior to the closing or settlement of a real estate transaction.
MLS Rules
We are also subject to rules, policies, data licenses, and terms of service established by over 115 MLSs of which we are a participant. These rules, policies, data licenses, and terms of service specify, among other things, how we may access and use MLS data and how MLS data must be displayed on our website and mobile application. The rules of each MLS to which we belong can vary widely and are complex. NAR, as well as state and local associations of REALTORS®, also have codes of ethics and rules governing members’ actions in dealings with other members, clients, and the public. We must comply with these codes of ethics and rules as a result of our membership in these organizations.
Title Service Regulation
Many states license and regulate title agencies or settlement service providers, their employees and underwriters. In many states, title insurance rates are either state-regulated or are required to be filed with each state by the agent or underwriter, and some states regulate the split of title insurance premiums between the agent and underwriter. States also require title agencies and title underwriters to meet certain minimum financial requirements for net worth and working capital.
Mortgage Products and Services Regulation
Our planned mortgage business will be subject to extensive federal, state, and local laws and regulations. Mortgage products are regulated at the state level by licensing authorities and administrative agencies, with additional oversight from the CFPB. We are required to obtain licensure as a mortgage banker or lender pursuant to applicable state law, and we are currently licensed, or are exempt or are otherwise not required to be licensed, to originate mortgage loans in Washington and Texas only.
The federal Secure and Fair Enforcement for Mortgage Licensing Act of 2008 requires all states to enact laws requiring individuals acting as mortgage loan originators to be individually licensed or registered. In addition to licensing requirements, we must also comply with numerous federal consumer protection laws, including, among others, the Fair Debt Collection Practices Act, Truth in Lending Act, Fair Credit Reporting Act, Equal Credit Opportunity Act, Homeowners Protection Act, Home Mortgage Disclosure Act, National Flood Insurance Reform Act of 1994, and the FHA.
87
Privacy and Consumer Protection Regulation
We are subject to a variety of federal and state laws relating to our collection, use and disclosure of data collected from our website and mobile users. Additionally, we are subject to regulations relating to the manner and circumstances under which we or third parties may market our products and services to customers such as “Do Not Email” laws. These laws include Federal Trade Commission regulations and other state and federal laws regarding data protection and retention, privacy and consumer protection, which are continuously evolving.
Labor Regulation
We are subject to federal and state regulations relating to our employment and compensation practices. We retain third-party licensed sales associates as associate agents whom we classify as independent contractors. Independent contractor classification is subject to a number of federal and state laws. See “Legal proceedings” for a discussion of three lawsuits, each of which includes class and/or representative claims, filed by former third-party licensed sales associates against us, alleging that they were improperly classified as independent contractors.
Intellectual Property
We rely on a combination of patents, trademarks, and trade secrets, as well as contractual provisions and restrictions to protect our intellectual property. As of December 31, 2016, we owned eight U.S. patents, 17 U.S. patent applications and one Canadian patent application. These patents and patent applications seek to protect proprietary inventions relevant to our business. We intend to pursue additional patent protection to the extent we believe it would be beneficial and cost effective.
We own 16 U.S. and two Canadian trademark registrations including “Redfin,” “Walk Score” “Title Forward” and related logos and designs. We also own five pending trademark applications, including “Redfin Estimate,” and several domain names including “Redfin,” “WalkScore,” our other trademarks and similar variations.
We rely on trade secrets and confidential information to develop and maintain our competitive position. We seek to protect our trade secrets and confidential information through a variety of methods, including confidentiality agreements with employees, third parties and others who may have access to our proprietary information. We also require employees to sign invention assignment agreements with respect to inventions arising from their employment, and strictly control access to our proprietary technology.
Facilities
We lease all of our facilities. Our principal executive office is in Seattle, Washington. The facility currently consists of approximately 84,000 square feet of space, and will expand to a total of approximately 113,000 square feet of space in January 2019. Our current lease, entered into in May 2016, expires August 2027 with two options to extend the lease for an additional seven years each.
We also lease additional office space in Arizona, California, Colorado, Florida, Georgia, Hawaii, Illinois, Maryland, Massachusetts, Missouri, Nevada, New Jersey, New York, North Carolina, Ohio, Oklahoma, Oregon, Pennsylvania, South Carolina, Texas, Virginia, Washington, and Washington, D.C. We intend to procure additional space in the future as we continue to add employees and expand our business. We believe our facilities are adequate and suitable for our current needs and that, should it be needed, suitable additional or alternative space will be available to accommodate our operations.
88
Legal Proceedings
From time to time we are involved in litigation, claims and other proceedings relating to the conduct of our business. Such litigation and other proceedings may include, but are not limited to, actions relating to employment law and misclassification, intellectual property, commercial arrangements, brokerage or real estate disputes, and vicarious liability based upon conduct of individuals or entities outside of our control including partner agents. Litigation and other disputes are inherently unpredictable and subject to substantial uncertainties and unfavorable resolutions could occur. Often these cases raise complex factual and legal issues, which are subject to risks and uncertainties and could require significant management time and resources. Litigation and regulatory proceedings could result in unexpected expenses and liabilities, and could materially adversely affect our reputation and results of operations. Other than with respect to the matters described below, we are not presently a party to any legal proceedings that in the opinion of management, if determined adversely to us, would individually or taken together reasonably be expected to result in a material loss.
Misclassification
In 2013, third-party licensed sales associates filed three lawsuits against us in the Superior Court of the State of California. Two of the actions, which are pled as “class actions,” were removed to and are now pending in the Northern District of California, assert claims on behalf of a putative class, and one of these cases also includes representative claims under California’s Private Attorney General Act, Labor Code section 2698 et seq, or PAGA. The third action is pending in the Los Angeles County Superior Court and asserts representative claims under PAGA. All three complaints allege that the plaintiffs and other licensed sales associates in California should be classified as employees instead of independent contractors. The claims vary from case to case, but generally seek compensation for unpaid wages, overtime, failure to provide meal and rest periods as well as reimbursement of business expenses. Each of these cases has been ordered to arbitration.
89
Executive Officers and Directors
The following table provides information regarding our executive officers and directors as of December 31, 2016.
| Name |
Age | Position(s) | ||||
| Executive Officers |
||||||
| Glenn Kelman |
46 | President, Chief Executive Officer and Director | ||||
| Chris Nielsen |
50 | Chief Financial Officer | ||||
| Bridget Frey |
39 | Chief Technology Officer | ||||
| Scott Nagel |
51 | President of Real Estate Operations | ||||
| Adam Wiener |
38 | Chief Growth Officer | ||||
| Non-Employee Directors |
||||||
| Robert Bass(1) |
67 | Director | ||||
| Julie Bornstein |
47 | Director | ||||
| Andrew Goldfarb |
48 | Director | ||||
| Paul Goodrich |
71 | Director | ||||
| Austin Ligon(1) |
65 | Director | ||||
| Robert Mylod(1) |
50 | Chairman of the Board | ||||
| James Slavet |
46 | Director | ||||
| Selina Tobaccowala |
40 | Director | ||||
| (1) | Member of the audit committee. |
| (2) | Member of the compensation committee. |
| (3) | Member of the nominating and corporate governance committee. |
Executive Officers
Glenn Kelman has served as our President and Chief Executive Officer and as a member of our board of directors since March 2006 after serving in a number of executive-level roles since 2005. Before joining us, Mr. Kelman was the co-founder of Plumtree Software, Inc., a provider of enterprise portal software products, where he served as the Vice President of Marketing and Product Management from 1997 to 2004. Mr. Kelman holds a B.A. in English from University of California, Berkeley. We believe that Mr. Kelman’s deep understanding of our company and his real estate industry experience qualifies him to serve on our board of directors.
Chris Nielsen has served as our Chief Financial Officer since June 2013. Before joining us, Mr. Nielsen served as Chief Financial Officer and Chief Operating Officer at Zappos.com, an online shoe and clothing subsidiary of Amazon.com, Inc., from 2010 to June 2013. Prior to that, Mr. Nielsen served as Vice President, Home & Garden at Amazon.com, Inc., an electronic commerce and cloud computing company, from 2003 to 2010. Mr. Nielsen holds a B.S. in Industrial Engineering from Stanford University and an M.B.A from MIT Sloan School of Management.
Bridget Frey has served as our Chief Technology Officer since February 2015 and previously as our Senior Vice President, Engineering from September 2014 to February 2015. Ms. Frey joined us in June 2011 as Director of Analytics Engineering and also served as our Vice President, Seattle Engineering from April 2012 to September 2014. Before joining us, Ms. Frey held various positions at Lithium Technologies, Inc., a software company, from 2007 to 2011, including as the Director of Analytics and Business Applications and a principal software engineer. Ms. Frey holds an A.B. in Computer Science from Harvard College.
Scott Nagel has served as our President of Real Estate Operations since April 2013 and previously as our Chief of Real Estate Operations from May 2012 to April 2013. Mr. Nagel joined us in
90
2007 as Vice President of Real Estate. Before joining us, Mr. Nagel served as Managing Director at LexisNexis, a division of Reed Elsevier Inc., a provider of legal research services, from 2003 to 2007. Prior to that, Mr. Nagel also served as Director, Client Solutions Group at Applied Discovery, Inc., a provider of electronic discovery services, from 2000 to 2003. Mr. Nagel holds a B.A. in Political Science from the University of Washington and a J.D. from Seattle University School of Law.
Adam Wiener has served as our Chief Growth Officer since May 2015. Mr. Wiener joined us in 2007 and previously served in various positions of increasing leadership, including as Lead Product Manager; Director, Partner Programs and New Products; Vice President, Analytics and New Business; and Senior Vice President, Marketing Analytics and New Business. Before joining us, Mr. Wiener served as Lead Program Manager at Microsoft, Inc., a global technology company, from 2002 to 2007. Mr. Wiener holds a B.S. in Symbolic Systems from Stanford University.
Non-Employee Directors
Robert Bass has served as a member of our board of directors since October 2016. Mr. Bass served as a vice chairman of Deloitte LLP from 2006 through June 2012, and was a partner at Deloitte LLP from 1982 through June 2012. Mr. Bass also serves on the board of directors of Groupon, Inc., a global leader in online local commerce, Sims Metal Management Ltd, a metals and electronics recycling company, and Apex Tool Group, LLC, a manufacturer of professional hand and power tools. We believe that Mr. Bass’s experience and knowledge of public company financial reporting and accounting, including with respect to companies in the online services sector, and his accounting firm leadership experience, qualifies him to serve on our board of directors.
Julie Bornstein has served as a member of our board of directors since October 2016. Since March 2015, Ms. Bornstein has served as Chief Operating Officer at Stitch Fix, Inc., an online styling services company. Prior to that, Ms. Bornstein served as Chief Marketing and Digital Officer at Sephora, a cosmetic products company and subsidiary of LVMH Moët Hennessy Louis Vuitton SE, from 2007 to March 2015. Ms. Bornstein also previously served on the boards of directors of a number of private companies. Ms. Bornstein holds an A.B. in Government from Harvard College and an M.B.A. from Harvard Business School. We believe that Ms. Bornstein’s senior leadership experience at various online services companies qualifies her to serve on our board of directors.
Andrew Goldfarb has served as a member of our board of directors since April 2013. Mr. Goldfarb co-founded and has been serving as the Executive Managing Director of Globespan Capital Partners, a venture capital firm, since 2003. Mr. Goldfarb currently serves on the board of directors of a number of private companies. Mr. Goldfarb holds an A.B. in East Asian Studies and Economics from Harvard College and an M.B.A. from Harvard Business School. We believe that Mr. Goldfarb’s experience advising and managing growth-oriented technology companies qualifies him to serve on our board of directors.
Paul Goodrich has served as a member of our board of directors since September 2005 and previously served as chairman of our board of directors from 2005 until August 2016. Mr. Goodrich has served as a Managing Director of Madrona Venture Group since 1995. Previously, Mr. Goodrich was a partner at Perkins Coie LLP, an international law firm, a co-founder of William D. Ruckelshaus Associates, an environmental consulting company, and a general partner of the Environmental Venture Fund, a venture capital fund. Mr. Goodrich currently serves on the board of directors of a number of private companies. Mr. Goodrich holds a B.A. in Economics from Amherst College and a J.D. from the University of Utah Law School. We believe that Mr. Goodrich’s experience advising and managing growth-oriented technology companies qualifies him to serve on our board of directors.
Austin Ligon has served as a member of our board of directors since September 2010. Previously, Mr. Ligon served as Chief Executive Officer of CarMax, Inc., America’s largest used-car
91
retailer, operating both through stores and online, from 2002 to 2006. Mr. Ligon also serves on the board of directors of a private online services company. Mr. Ligon holds a B.A. in the Plan II Honors Program and an M.A. in Economics from the University of Texas at Austin, as well as an M.B.A. from Yale School of Management. We believe that Mr. Ligon’s executive officer experience at an online retailer with distributed field operations qualifies him to serve on our board of directors.
Robert Mylod has served as a member of our board of directors since January 2014 and has served as chairman of our board of directors since August 2016. Mr. Mylod has served as the Managing Partner of Annox Capital since January 2012. Previously, Mr. Mylod was Chief Financial Officer and Vice Chairman, Head of Worldwide Strategy and Planning at Priceline.com, an online travel services provider. Mr. Mylod also currently serves on the board of directors of a number of private companies. Mr. Mylod holds an A.B. in English from the University of Michigan and an M.B.A. from the University of Chicago Booth School of Business. We believe that Mr. Mylod’s experience as a venture capital investor and a senior finance executive, including as the chief financial officer of a large publicly-traded online services provider, qualifies him to serve on our board of directors.
James Slavet has served as a member of our board of directors since November 2010. Mr. Slavet has served as a Partner of Greylock Partners since 2006. Previously, Mr. Slavet served as Vice President/General Manager in Search & Marketplace at Yahoo! Inc., a global technology company from 2004 to 2006. Prior to that, Mr. Slavet founded and served as Chief Operating Officer of Guru Inc., an online contractor marketplace subsequently acquired by Unicru, Inc. Mr. Slavet currently serves on the board of directors of a number of private companies. Mr. Slavet holds a B.A. in Public Policy from Brown University and an M.B.A. from Harvard Business School. We believe that Mr. Slavet’s experience advising and managing growth-oriented technology companies, including as an operating executive, qualifies him to serve on our board of directors.
Selina Tobaccowala has served as a member of our board of directors since January 2014. Ms. Tobaccowala has served as Chief Executive Officer and co-founder of Gixo Inc. since April 2016 and previously served as President and Chief Technology Officer of SurveyMonkey Inc., an online survey development company, from October 2009 to April 2016. Previously, Ms. Tobaccowala was Senior Vice President of Product & Technology at Ticketmaster Europe, Inc., an online retailer of tickets for events and subsidiary of Ticketmaster Entertainment, Inc., which was subsequently acquired by Live Nation Entertainment, and co-founder and Vice President of Engineering at Evite, Inc., an online social-planning website and subsidiary of IAC/InterActiveCorp, which was subsequently acquired by Liberty Media Group. Ms. Tobaccowala holds a B.S. in Computer Science from Stanford University. We believe that Ms. Tobaccowala’s senior leadership experience at multiple online services companies qualifies her to serve on our board of directors.
Election of Officers
Our executive officers are appointed by, and serve at the discretion of, our board of directors. There are no family relationships among any of our directors or executive officers.
Codes of Business Conduct and Ethics
Prior to the completion of this offering, our board of directors will adopt a code of business conduct and ethics that applies to all of our employees, officers and directors, including our Chief Executive Officer, Chief Financial Officer and other executive and senior financial officers. The full text of our code of conduct will be posted on the investor relations section of our website at www.redfin.com. The reference to our website address in this prospectus does not include or incorporate by reference the information on our website into this prospectus. We intend to disclose future amendments to certain provisions of our code of conduct, or waivers of these provisions, on our website or in public filings to the extent required by the applicable rules and exchange requirements.
92
Board of Directors Composition
Our board of directors may establish the authorized number of directors from time to time by resolution. Our board of directors currently consists of nine members. Eight of our directors are independent within the meaning of the independent director guidelines of . Our current certificate of incorporation and amended and restated voting agreement among certain of our stockholders provide for (1) one director to be designated by holders of our Series A preferred stock, who is currently Mr. Goodrich; (2) one director to be designated by holders of our Series D preferred stock, who is currently Mr. Slavet, (3) one director to be designated by holders of our Series E preferred stock, who is currently Mr. Goldfarb; (4) one director to be our current Chief Executive Officer, who is currently Mr. Kelman; and (5) five remaining directors to be designated by the other members of our board of directors, who are currently Messrs. Mylod, Ligon and Bass, and Mss. Tobaccowala and Bornstein.
The provisions of our current certificate of incorporation and our amended and restated voting agreement by which our directors were elected will terminate in connection with our initial public offering and there will be no contractual obligations regarding the election of our directors. Each of our current directors will continue to serve until the election and qualification of his or her successor, or his or her earlier death, resignation or removal.
Classified Board of Directors
Upon completion of this offering, our board of directors will be divided into three staggered classes of directors. At each annual meeting of stockholders, a class of directors will be elected for a three-year term to succeed the same class whose term is then expiring. As a result, only one class of directors will be elected at each annual meeting of our stockholders, with the other classes continuing for the remainder of their respective three-year terms. Our directors will be divided among the three classes as follows:
| • | the Class I directors will be , and , and their terms will expire at the first annual meeting of stockholders to be held after completion of this offering; |
| • | the Class II directors will be , and , and their terms will expire at the second annual meeting of stockholders to be held after completion of this offering; and |
| • | the Class III directors will be , and , and their terms will expire at the third annual meeting of stockholders to be held after completion of this offering. |
Each director’s term continues until the election and qualification of his or her successor, or his or her earlier death, resignation, or removal. Our restated certificate of incorporation and bylaws that will be in effect upon the completion of this offering, will authorize only our board of directors to fill vacancies on our board of directors. Any increase or decrease in the number of directors will be distributed among the three classes so that, as nearly as possible, each class will consist of one-third of the directors. This classification of our board of directors may have the effect of delaying or preventing changes in control of our company. See “Description of Capital Stock—Anti-Takeover Provisions—Restated Certificate of Incorporation and Restated Bylaw Provisions.”
Director Independence
In connection with this offering, we intend to list our common stock on the . Under the rules of the , independent directors must comprise a majority of a listed company’s board of directors within a specified period of the completion of this offering. In addition, the rules of the
93
require that, subject to specified exceptions, each member of a listed company’s audit, compensation and nominating and corporate governance committees be independent. Under the rules of the , a director will only qualify as an “independent director” if, in the opinion of that company’s board of directors, that person does not have a relationship that would interfere with the exercise of independent judgment in carrying out the responsibilities of a director.
Audit committee members must also satisfy the independence criteria set forth in Rule 10A-3 under the Securities Exchange Act of 1934, as amended, or Exchange Act. In order to be considered independent for purposes of Rule 10A-3, a member of an audit committee of a listed company may not, other than in his or her capacity as a member of the audit committee, the board of directors or any other board committee: (1) accept, directly or indirectly, any consulting, advisory or other compensatory fee from the listed company or any of its subsidiaries; or (2) be an affiliated person of the listed company or any of its subsidiaries. We intend to satisfy the audit committee independence requirements of Rule 10A-3 as of the completion of this offering.
Our board of directors has undertaken a review of the independence of each director and considered whether each director has a material relationship with us that could compromise his ability to exercise independent judgment in carrying out his responsibilities. As a result of this review, our board of directors determined that all of our non-employee directors are “independent directors” as defined under the applicable rules and regulations of the SEC and the listing requirements and rules of the . In making these determinations, our board of directors reviewed and discussed information provided by the directors and us with regard to each director’s business and personal activities and relationships as they may relate to us and our management, including the beneficial ownership of our capital stock by each non-employee director and the transactions involving them described under “Certain Relationships and Related-Party Transactions.”
Committees of the Board of Directors
Our board of directors has an audit committee, a compensation committee and a nominating and corporate governance committee, each of which will have the composition and responsibilities described below as of the closing of our initial public offering. Members serve on these committees until their resignation or until otherwise determined by our board of directors. Each committee will operate under a charter approved by our board of directors. Following this offering, copies of each committee’s charter will be posted on the investor relations section of our website at www.redfin.com.
Audit Committee
Our audit committee is comprised of Messrs. Bass, Ligon, and Mylod. Mr. Bass is the chairman of our audit committee. The composition of our audit committee meets the requirements for independence under the current and SEC rules and regulations. Each member of our audit committee is financially literate. In addition, our board of directors has determined that Mr. is an “audit committee financial expert” as defined in Item 407(d)(5)(ii) of Regulation S-K promulgated under the Securities Act. This designation does not impose on him any duties, obligations or liabilities that are greater than are generally imposed on members of our audit committee and our board of directors. The audit committee assists our board of directors in overseeing the quality and integrity of our accounting, auditing, and reporting practices. The audit committee’s role includes:
| • | overseeing the work of our accounting function and internal controls over financial reporting; |
| • | overseeing internal audit processes; |
94
| • | inquiring about significant risks, reviewing our policies for risk assessment and risk management, including cybersecurity risks, and assessing the steps management has taken to control these risks; and |
| • | reviewing compliance with significant applicable legal, ethical, and regulatory requirements. |
Our audit committee is responsible for the appointment, compensation, retention, and oversight of the independent registered public accounting firm engaged to issue audit reports on our consolidated financial statements and internal control over financial reporting. The audit committee relies on the expertise and knowledge of management and the independent registered public accounting firm in carrying out its overnight responsibilities.
Compensation Committee
Our compensation committee is comprised of , and .. is the chairperson of our compensation committee. The composition of our compensation committee meets the requirements for independence under the current listing standards and SEC rules and regulations. Each member of this committee is an outside director, as defined pursuant to Section 162(m) of the Internal Revenue Code of 1984, as amended, or the Code. Our compensation committee is responsible for, among other things:
| • | reviewing and approving, or recommending that our board of directors approve, the compensation of our executive officers; |
| • | reviewing and recommending to our board of directors the compensation of our directors; |
| • | reviewing and recommending to our board of directors the terms of any compensatory agreements with our executive officers; |
| • | administering our stock and equity incentive plans; |
| • | reviewing and approving, or making recommendations to our board of directors with respect to, incentive compensation and equity plans; and |
| • | reviewing our overall compensation philosophy. |
Nominating and Corporate Governance Committee
Our nominating and corporate governance committee is comprised of , and . is the chairperson of our nominating and corporate governance committee. The composition of our nominating and corporate governance committee meets the requirements for independence under the current listing standards and SEC rules and regulations. Our nominating and corporate governance committee is responsible for, among other things:
| • | identifying and recommending candidates for membership on our board of directors; |
| • | reviewing and recommending our corporate governance guidelines and policies; |
| • | reviewing proposed waivers of the code of conduct for directors and executive officers; |
| • | overseeing the process of evaluating the performance of our board of directors; and |
| • | assisting our board of directors on corporate governance matters. |
95
Compensation Committee Interlocks and Insider Participation
None of our executive officers has served as a member of the board of directors, or as a member of the compensation or similar committee, of any entity that has one or more executive officers who served on our board of directors or compensation committee during 2016.
Non-Employee Director Compensation
The following table presents the total compensation for each person who served as a non-employee member of our board of directors in 2016. Other than as set forth in the table, in 2016, we did not make any equity awards or non-equity awards to, or pay any other compensation to the non-employee members of our board of directors. Mr. Kelman, our Chief Executive Officer, received no compensation for his service as a director in 2016.
| Name |
Option Awards ($)(1) |
Total ($) |
||||||
| Robert Bass(2) |
$ | 246,000 | $ | 246,000 | ||||
| Julie Bornstein(3) |
184,500 | 184,500 | ||||||
| Andrew Goldfarb |
— | — | ||||||
| Paul Goodrich |
— | — | ||||||
| Austin Ligon(4) |
346,830 | 346,830 | ||||||
| Robert Mylod(5) |
396,000 | 396,000 | ||||||
| James Slavet |
— | — | ||||||
| Selina Tobaccowala(6) |
297,000 | 297,000 | ||||||
| (1) | The amounts reported in this column represent the aggregate grant date fair value of the stock options granted to our directors during the year ended December 31, 2016 as computed in accordance with Accounting Standards Codification Topic 718. The assumptions used in calculating the aggregate grant date fair value of the stock options reported in this column are set forth in Note 6 to our consolidated financial statements included elsewhere in this prospectus. The amounts reported in this column reflect the accounting cost for these stock options, and do not correspond to the actual economic value that may be received by our directors from the stock options. |
| (2) | As of December 31, 2016, Mr. Bass held options for the purchase of 200,000 shares of our common stock, 16,666 shares of which were vested as of such date. |
| (3) | As of December 31, 2016, Ms. Bornstein held options for the purchase of 150,000 shares of our common stock, 12,500 shares of which were vested as of such date. |
| (4) | As of December 31, 2016, Mr. Ligon held options for the purchase of 112,700 shares of our common stock, 31,305 shares of which were vested as of such date. |
| (5) | As of December 31, 2016, Mr. Mylod held options for the purchase of 400,000 shares of our common stock, 291,666 shares of which were vested as of such date. |
| (6) | As of December 31, 2016, Ms. Tobaccowala held options for the purchase of 300,000 shares of our common stock, 218,750 shares of which were vested as of such date. |
Following the completion of this offering, we intend to adopt a policy for compensating our non-employee directors with a combination of cash and equity.
96
The following tables and accompanying narrative disclosure set forth information about the compensation provided to our executive officers during 2016. These executive officers, who include our principal executive officer and the two most highly-compensated executive officers (other than our principal executive officer) who were serving as executive officers at the end of 2016, were:
| • | Glenn Kelman, President, Chief Executive Officer and Director; |
| • | Bridget Frey, Chief Technology Officer; and |
| • | Scott Nagel, President of Real Estate Operations. |
We refer to these individuals as our “named executive officers.”
2016 Summary Compensation Table
The following table provides information regarding the compensation of our named executive officers who were serving as executive officers as of December 31, 2016.
| Name and Principal Position |
Salary ($) |
Option Awards ($)(1) |
Non-Equity Incentive Plan Compensation ($)(2) |
Total ($) |
||||||||||||
| Glenn Kelman |
$ | 250,871 | $ | 68,258 | $ | $ | ||||||||||
| President and Chief Executive Officer |
||||||||||||||||
| Bridget Frey |
250,681 | 396,000 | ||||||||||||||
| Chief Technology Officer |
||||||||||||||||
| Scott Nagel |
250,724 | 396,000 | ||||||||||||||
| President of Real Estate Operations |
||||||||||||||||
| (1) | The amounts reported in this column represent the aggregate grant date fair value of the stock options granted to our named executive officers during the year ended December 31, 2016 as computed in accordance with Accounting Standards Codification Topic 718. The assumptions used in calculating the aggregate grant date fair value of the stock options reported in this column are set forth in Note 6 to our consolidated financial statements included in this prospectus. The amounts reported in this column reflect the accounting cost for these stock options, and do not correspond to the actual economic value that may be received by our named executive officers from the stock options. |
| (2) | We currently anticipate that non-equity incentive compensation plan payouts for 2016 will be considered and determined by our board of directors and paid to our named executive officers in February 2017. For additional information, see “—Non-Equity Incentive Plan Compensation.” |
Non-Equity Incentive Plan Compensation
Each of our named executive officers participated in our 2016 executive bonus plan. Each participant was eligible to receive cash incentive-based compensation for 2016 based on specified company-performance goals, including revenue, customer satisfaction as measured by Net Promoter Score, and gross margin in certain of our large markets. We currently anticipate that bonuses for 2016 will be considered and determined by our board of directors and paid to our named executive officers in February 2017.
Equity Awards
At the discretion of our board of directors, in February 2016 and September 2016, our board of directors granted Mr. Kelman an option to purchase 30,143 and 24,444 shares of common stock, respectively, with an exercise price per share of $2.99 and $2.70 per share, respectively. Each of the option awards granted to Mr. Kelman in 2016 was fully vested at the time of grant. Additionally, in May
97
2016, our board of directors granted each of Ms. Frey and Mr. Nagel options to purchase 300,000 shares of our common stock with an exercise price of $3.05 per share. Each of Ms. Frey’s and Mr. Nagel’s option awards vests with respect to 25% of the shares underlying the option on the one-year anniversary of the vesting commencement date and the remaining 75% of the shares underlying the option vest in 36 equal monthly installments.
Executive Employment Arrangements
Each of our named executive officers is employed at will and their compensation is reviewed periodically and subject to the discretion of our board of directors. We intend to enter into amended and restated offer letters with each of our named executive officers in connection with this offering. We expect that each of these amended and restated offer letters will provide for at-will employment and include each officer’s base salary, a discretionary incentive bonus opportunity and standard employee benefit plan participation.
Outstanding Equity Awards at Year-End Table
The following table presents, for each of our named executive officers, information regarding outstanding stock options and other equity awards held as of December 31, 2016.
| Option Awards(1) | ||||||||||||||||||||
| Name |
Vesting Commencement Date |
Number of Securities Underlying Unexercised Options Exercisable (#) |
Number of Securities Underlying Unexercised Options Unexercisable (#) |
Option Exercise Price ($) |
Option Expiration Date |
|||||||||||||||
| Glenn Kelman |
08/16/2011 | 540,938 | — | $ | 0.12 | 08/16/2021 | ||||||||||||||
| 07/26/2013 | 494,792 | (2) | 138,542 | 1.25 | 11/26/2023 | |||||||||||||||
| 11/23/2015 | 392,708 | (3) | 1,057,292 | 2.87 | 11/23/2025 | |||||||||||||||
| 02/03/2016 | 30,143 | — | 2.99 | 02/03/2026 | ||||||||||||||||
| 09/27/2016 | 24,444 | — | 2.70 | 09/29/2026 | ||||||||||||||||
| Bridget Frey |
06/20/2011 | 143,750 | (3) | — | 0.12 | 08/16/2021 | ||||||||||||||
| 03/01/2012 | 245,000 | (3) | — | 0.47 | 04/12/2022 | |||||||||||||||
| 04/01/2013 | 320,833 | (3) | 29,167 | 0.59 | 06/18/2023 | |||||||||||||||
| 11/25/2013 | 57,812 | (3) | 17,188 | 1.25 | 11/26/2023 | |||||||||||||||
| 11/25/2013 | 231,250 | (3) | 68,750 | 1.25 | 11/26/2023 | |||||||||||||||
| 05/04/2014 | 121,073 | (3) | 66,395 | 2.14 | 07/10/2024 | |||||||||||||||
| 08/24/2014 | 60,974 | (3) | 43,553 | 2.13 | 10/14/2024 | |||||||||||||||
| 01/01/2015 | 335,416 | (3) | 364,584 | 2.46 | 04/13/2025 | |||||||||||||||
| 05/01/2015 | 60,701 | (3) | 92,649 | 2.87 | 10/28/2025 | |||||||||||||||
| 05/02/2016 | — | 300,000 | (3) | 3.05 | 05/11/2026 | |||||||||||||||
| Scott Nagel |
12/08/2009 | 500,000 | — | 0.12 | 12/08/2019 | |||||||||||||||
| 05/01/2011 | 200,000 | — | 0.12 | 08/16/2021 | ||||||||||||||||
| 04/01/2012 | 455,000 | — | 0.47 | 04/12/2022 | ||||||||||||||||
| 05/01/2013 | 582,291 | (3) | 67,709 | 0.59 | 06/18/2023 | |||||||||||||||
| 05/04/2014 | 134,525 | (3) | 73,772 | 2.14 | 07/10/2024 | |||||||||||||||
| 05/01/2015 | 149,486 | (3) | 228,165 | 2.87 | 10/28/2025 | |||||||||||||||
| 05/02/2016 | — | 300,000 | (3) | 3.05 | 05/11/2026 | |||||||||||||||
| (1) | All of the outstanding equity awards were granted under our Amended and Restated 2004 Equity Incentive Plan. |
| (2) | Vests in equal monthly installments over four years measured from the vesting commencement date. |
| (3) | Vests with respect to 25% of the shares underlying the option on the one-year anniversary of the vesting commencement date and the remaining 75% of the shares underlying the option vest in equal monthly installments over three years. |
98
Employee Benefit Plans
2017 Equity Incentive Plan
We intend to adopt a 2017 Equity Incentive Plan that will become effective on the date immediately prior to the date of this prospectus and will serve as the successor to our Amended and Restated 2004 Equity Incentive Plan, or our 2004 Plan. We intend to reserve shares of our common stock to be issued under our 2017 Equity Incentive Plan plus shares reserved but not issued or subject to outstanding grants under our 2004 Plan on the date immediately prior to the date of this prospectus. The number of shares that will be reserved for issuance under our 2017 Equity Incentive Plan will increase automatically on January 1 of each of year through by the number of shares equal to % of the total outstanding shares of our common stock as of the immediately preceding December 31. However, our board of directors or compensation committee may reduce the amount of the increase in any particular year. In addition, the following shares will again be available for grant and issuance under our 2017 Equity Incentive Plan:
| • | shares subject to options or stock appreciation rights granted under our 2017 Equity Incentive Plan that cease to be subject to the option or stock appreciation right for any reason other than exercise of the option or stock appreciation right; |
| • | shares subject to awards granted under our 2017 Equity Incentive Plan that are subsequently forfeited or repurchased by us at the original issue price; |
| • | shares subject to awards granted under our 2017 Equity Incentive Plan that otherwise terminate without shares being issued; |
| • | shares surrendered, cancelled, or exchanged for cash or a different award (or combination thereof); |
| • | shares issuable upon the exercise of options or subject to other awards under our 2004 Plan prior to the date of this prospectus that cease to be subject to such options or other awards by forfeiture or otherwise after the date of this prospectus; |
| • | shares issued under our 2004 Plan that are forfeited or repurchased by us at the original issue price after the date of this prospectus; and |
| • | shares subject to awards under our 2004 Plan or 2017 Equity Incentive Plan that are used to pay the exercise price of an option or withheld to satisfy the tax withholding obligations related to any award. |
Our 2017 Equity Incentive Plan will authorize the award of stock options, restricted stock awards, or RSAs, stock appreciation rights, or SARs, restricted stock units, or RSUs, performance awards and stock bonuses. No person will be eligible to receive more than shares in any calendar year under our 2017 Equity Incentive Plan other than a new employee of ours, who will be eligible to receive no more than shares under the plan in the calendar year in which the employee commences employment. The aggregate number of shares of our common stock that may be subject to awards granted to any one non-employee director pursuant to the 2017 Plan in any calendar year shall not exceed such number of shares with an aggregate grant date value of .
Our 2017 Equity Incentive Plan will be administered by our compensation committee, all of the members of which are outside directors as defined under applicable federal tax laws, or by our board of directors acting in place of our compensation committee. The compensation committee will have the
99
authority to construe and interpret our 2017 Equity Incentive Plan, grant awards and make all other determinations necessary or advisable for the administration of the plan.
Our 2017 Equity Incentive Plan will provide for the grant of awards other than incentive stock options to our employees, directors, consultants, independent contractors and advisors, provided the consultants, independent contractors, directors and advisors render services not in connection with the offer and sale of securities in a capital-raising transaction. Incentive stock options may be granted only to our employees.
A stock option is the right, but not the obligation, to purchase a share of our common stock at a certain price and upon certain conditions. The exercise price of stock options must be at least equal to the fair market value of our common stock on the date of grant. The exercise price of incentive stock options granted to 10% stockholders must be at least equal to 110% of the fair market value on the date of grant (and have a term that does not exceed five years). Options may vest based on time or achievement of performance conditions. Our compensation committee may provide for options to be exercised only as they vest or to be immediately exercisable with any shares issued on exercise being subject to our right of repurchase that lapses as the shares vest. The maximum term of options granted under our 2017 Equity Incentive Plan is ten years.
A restricted stock award is an offer by us to sell shares of our common stock subject to restrictions, which may vest based on time or achievement of performance conditions. The price (if any) of an RSA will be determined by the compensation committee. Unless otherwise determined by the compensation committee at the time of award, vesting will cease on the date the participant no longer provides services to us and unvested shares will be forfeited to or repurchased by us.
Stock appreciation rights provide for a payment, or payments, in cash or shares of our common stock, to the holder based upon the difference between the fair market value of our common stock on the date of exercise and the stated exercise price up to a maximum amount of cash or number of shares. The exercise price of stock appreciation rights must be at least equal to the fair market value of our common stock on the date of grant. Stock appreciation rights may vest based on time or achievement of performance conditions.
Restricted stock units represent the right to receive shares of our common stock at a specified date in the future, subject to forfeiture of that right because of termination of employment or failure to achieve certain performance conditions. If a restricted stock unit has not been forfeited, then on the date specified in the restricted stock unit agreement, we will deliver to the holder of the restricted stock unit whole shares of our common stock (which may be subject to additional restrictions), cash or a combination of our common stock and cash.
Performance awards are awards that cover a number of shares of our common stock that may be settled upon achievement of pre-established performance conditions in cash or by issuance of the underlying shares. These awards are subject to forfeiture prior to settlement because of termination of employment or failure to achieve the performance conditions.
Stock bonuses may be granted as additional compensation for service or performance, in the form of cash, common stock or a combination thereof, and may be subject to restrictions, which may vest based on time or achievement of performance conditions.
In the event there is a specified type of change in our capital structure without receipt of consideration, such as a stock split, appropriate adjustments will be made to the number and class of shares reserved under our 2017 Equity Incentive Plan, the maximum number and class of shares that can be granted in a calendar year and the number and class of shares and exercise price, if applicable, of all outstanding awards under our 2017 Equity Incentive Plan.
100
The 2017 Plan permits the grant of performance-based stock and cash awards that may qualify as performance-based compensation that is not subject to the $1,000,000 limitation on income tax deductibility imposed by Section 162(m) of the Code. Our compensation committee may structure awards so that the stock or cash will be issued or paid only following the achievement of certain pre-established performance goals during a designated performance period.
Awards granted under our 2017 Equity Incentive Plan may not be transferred in any manner other than by will or by the laws of descent and distribution or as determined by our compensation committee. Unless otherwise permitted by our compensation committee, stock options may be exercised during the lifetime of the optionee only by the optionee or the optionee’s guardian or legal representative. Options granted under our 2017 Equity Incentive Plan generally may be exercised for a period of three months after the termination of the optionee’s service to us, for a period of 12 months in the case of death or for a period of 12 months in the case of disability, or such other period as our compensation committee may provide, subject to the limitations set forth in our 2017 Equity Incentive Plan. Options generally terminate immediately upon termination of employment for cause.
If we are party to a merger or consolidation, outstanding awards, including any vesting provisions, may be assumed or substituted by the successor company. In the alternative, outstanding awards may be cancelled in connection with a cash payment. Outstanding awards that are not assumed, substituted or cashed out will upon the merger or consolidation.
Our 2017 Equity Incentive Plan will terminate ten years from the date our board of directors approves the plan, unless it is terminated earlier by our board of directors. Our board of directors may amend or terminate our 2017 Equity Incentive Plan at any time. If our board of directors amends our 2017 Equity Incentive Plan, it does not need to ask for stockholder approval of the amendment unless required by applicable law.
Amended and Restated 2004 Equity Incentive Plan
Our board of directors adopted and our stockholders approved our 2004 Equity Incentive Plan in November 2004. The Amended and Restated 2004 Equity Incentive Plan was adopted by our board of directors and approved by our stockholders in December 2005. The 2004 Plan has since been amended and restated from time to time. Our 2004 Plan provides for the grant of incentive stock options, within the meaning of Section 422 of the Code, to our employees or any parent or subsidiary’s employees and for the grant of nonstatutory stock options to our employees, directors, consultants and any parent or subsidiary’s employees and consultants. Stock bonus awards and restricted stock awards may also be granted under the 2004 Plan. As of December 31, 2016, a total of 89,651,602 shares had been approved for issuance under the 2004 Plan, options to purchase 39,876,938 shares of our common stock were outstanding under our 2004 Plan and 14,821,690 shares remained available for the grant of future awards under our 2004 Plan. All shares of our common stock reserved but not ultimately issued or subject to awards that have expired or otherwise terminated under our 2004 Plan without having been exercised in full are reserved for issuance under our 2017 Equity Incentive Plan. Upon the completion of this offering we will cease issuing awards under our 2004 Plan and intend to grant all future equity awards under our 2017 Equity Incentive Plan.
In the event of a change in control as defined in the 2004 Plan, the 2004 Plan provides that, unless otherwise provided in an option agreement, awards shall be assumed by the successor entity or converted into or replaced with comparable awards of the successor entity, and, if such awards are not assumed, converted or replaced by the successor entity, unexercised options or other outstanding awards held by individuals whose service with us has not terminated will, unless otherwise provided by our board of directors, accelerate and become exercisable immediately prior to the consummation of such change in control and, if unexercised, will terminate upon the consummation of such change in
101
control. If such awards are assumed, converted or replaced by the successor entity, any such awards shall have their vesting or exercise schedule accelerated by twelve (12) months. Under the 2004 Plan, a “change in control” means (1) the consummation of a merger or consolidation of us with or into another entity or any other stock acquisition or corporate reorganization, if more than 50% of the combined voting power of the continuing or surviving entity’s securities outstanding immediately after such merger, consolidation, stock acquisition or other reorganization is owned by persons who were not our stockholders immediately prior to such merger, consolidation, stock acquisition or other reorganization; or (2) the sale, transfer or other disposition of all or substantially all of our assets. A transaction shall not constitute a “change in control” if its sole purpose is to change our state of incorporation or to create a holding company that will be owned in substantially the same proportions by the persons who held our securities immediately before such transaction. In the event that any amount paid or deemed paid under the 2004 Plan would constitute an excess parachute payment within the meaning of Section 280G of the Code, the amounts paid or deemed paid will be reduced so that such no such payments will constitute excess parachute payments.
Our board of directors currently administers our 2004 Plan. Our board of directors has the authority to amend, suspend or terminate the 2004 Plan, provided that no amendment may adversely affect awards already granted without the written consent of the holder of the affected award. Our stockholders approve actions to the extent stockholder approval is necessary to satisfy the applicable requirements of Section 422 of the Code. Our 2004 Plan also provides for proportional adjustment of awards in the event of a stock split, stock dividend and certain other similar corporate events.
401(k) Plan
We sponsor a retirement plan intended to qualify for favorable tax treatment under Section 401(a) of the Code, containing a cash or deferred feature that is intended to meet the requirements of Section 401(k) of the Code. U.S. employees who have attained at least 21 years of age are generally eligible to participate in the plan on the first day of the calendar month following the employees’ date of hire, subject to certain eligibility requirements. Participants may make pre-tax contributions to the plan from their eligible earnings up to the statutorily prescribed annual limit on pre-tax contributions under the Code. Pre-tax contributions by participants and the income earned on those contributions are generally not taxable to participants until withdrawn. Participant contributions are held in trust as required by law. No minimum benefit is provided under the plan. An employee’s interest in his or her pre-tax deferrals is 100% vested when contributed. Although the plan provides for a discretionary employer matching contribution, to date we have not made such a contribution on behalf of employees.
Limitations on Liability and Indemnification Matters
Our restated certificate of incorporation that will become effective in connection with the completion of this offering, contains provisions that will limit the liability of our directors for monetary damages to the fullest extent permitted by the DGCL. Consequently, our directors will not be personally liable to us or our stockholders for monetary damages for any breach of fiduciary duties as directors, except liability for:
| • | any breach of the director’s duty of loyalty to us or our stockholders; |
| • | any act or omission not in good faith or that involves intentional misconduct or a knowing violation of law; |
| • | unlawful payments of dividends or unlawful stock repurchases or redemptions as provided in Section 174 of the DGCL; or |
102
| • | any transaction from which the director derived an improper personal benefit. |
Our restated certificate of incorporation and our restated bylaws that will become effective in connection with the completion of this offering require us to indemnify our directors and officers to the maximum extent not prohibited by the DGCL and allow us to indemnify other employees and agents as set forth in the DGCL. Subject to certain limitations, our restated bylaws will also require us to advance expenses incurred by our directors and officers for the defense of any action for which indemnification is required or permitted, subject to very limited exceptions.
In connection with this offering, we intend to enter into amended and restated indemnification agreements with each of our directors and officers. These agreements, among other things, will require us to indemnify our directors and officers for certain expenses, including attorneys’ fees, judgments, penalties, fines and settlement amounts actually incurred by such director or officer in any action or proceeding arising out of their service to us or any of our subsidiaries or any other company or enterprise to which the person provides services at our request. Subject to certain limitations, our indemnification agreements will also require us to advance expenses incurred by our directors and officers for the defense of any action for which indemnification is required or permitted.
We believe that these charter provisions and indemnification agreements are necessary to attract and retain qualified persons such as directors and officers. We also maintain directors’ and officers’ liability insurance.
The limitation of liability and indemnification provisions in our restated certificate of incorporation and restated bylaws may discourage stockholders from bringing a lawsuit against our directors and officers for breach of their fiduciary duty. They may also reduce the likelihood of derivative litigation against our directors and officers, even though an action, if successful, might benefit us and other stockholders. Further, a stockholder’s investment may be adversely affected to the extent that we pay the costs of settlement and damage awards against directors and officers as required by these indemnification provisions.
At present, there is no pending litigation or proceeding involving any of our directors or executive officers as to which indemnification is required or permitted, and we are not aware of any threatened litigation or proceeding that may result in a claim for indemnification.
Insofar as indemnification for liabilities arising under the Securities Act may be permitted to directors, executive officers or persons controlling us, we have been informed that in the opinion of the SEC such indemnification is against public policy as expressed in the Securities Act and is therefore unenforceable.
103
CERTAIN RELATIONSHIPS AND RELATED-PARTY TRANSACTIONS
In addition to the executive officer and director compensation arrangements discussed above under “Management—Non-Employee Director Compensation” and “Executive Compensation,” below we describe transactions since January 1, 2014 to which we have been or will be a participant, in which the amount involved in the transaction exceeds or will exceed $120,000 and in which any of our directors, executive officers, or beneficial holders of more than five percent of any class of our capital stock, or any immediate family member of, or person sharing the household with, any of these individuals, had or will have a direct or indirect material interest.
2015 Third-Party Tender Offer
In June 2015, we entered into a letter agreement with certain holders of our capital stock pursuant to which we agreed to waive certain transfer restrictions in connection with, and assist in the administration of, a tender offer that such holders proposed to commence. In June 2015, these holders commenced a tender offer to purchase shares of our outstanding capital stock at a price per share of $3.2977, less transaction costs, pursuant to an offer to purchase to which we were not a party.
Adam Wiener, Bridget Frey, Chris Nielsen and Scott Nagel, each of whom is an executive officer, sold shares of our capital stock in the tender offer, which closed in August 2015.
An aggregate of 4,780,236 shares of our capital stock were tendered pursuant to the tender offer, of which entities affiliated with T. Rowe Price purchased 1,912,094 shares for an aggregate purchase price of $6,305,512, and Tiger Global Private Investment Partners IX, L.P. purchased 2,867,024 shares for an aggregate purchase price of $9,454,585. Each of T. Rowe Price and Tiger Global Private Investment Partners IX, L.P., together with its respective affiliates, is a beneficial holder of more than five percent of our outstanding capital stock.
Series G Preferred Stock Financing
In December 2014, we sold an aggregate of 21,527,376 shares of our Series G preferred stock at a purchase price of $3.2977 per share for an aggregate purchase price of approximately $71.0 million. Each share of our Series G preferred stock will convert automatically into one share of our common stock upon the completion of this offering.
The purchasers of our Series G preferred stock are entitled to specified registration rights. For additional information, see “Description of Capital Stock—Registration Rights.” The terms of these purchases were the same for all purchasers of our Series G preferred stock. See “Principal Stockholders” for more details regarding the shares held by these entities.
The following table summarizes the Series G preferred stock purchased by members of our board of directors or their affiliates and holders of more than five percent of our outstanding capital stock:
| Name of Related Party |
Shares of Series G Preferred Stock |
Total Purchase Price | ||||||
| Tiger Global Private Investment Partners VII, L.P.(1) |
1,852,760 | $ | 6,109,847 | |||||
| Affiliates of T. Rowe Price New Horizons Fund, Inc.(2) |
1,516,205 | 4,999,989 | ||||||
| Annox Capital, LLC(3) |
758,104 | 2,500,000 | ||||||
| (1) | Tiger Global Private Investment Partners VII, L.P. and its affiliates beneficially own more than five percent of our capital stock. |
| (2) | T. Rowe Price New Horizons Fund, Inc. and its affiliates beneficially own more than five percent of our capital stock. |
| (3) | Robert Mylod, a member of our board of directors, is Managing Member of Annox Capital, LLC. |
104
Series F Preferred Stock Financing
In multiple closings in November 2013 and February 2014, we sold an aggregate of 20,808,580 shares of our Series F preferred stock at a purchase price of $2.4286 per share for an aggregate purchase price of approximately $50.5 million. Each share of our Series F preferred stock will convert automatically into one share of our common stock upon the completion of this offering.
The purchasers of our Series F preferred stock are entitled to specified registration rights. For additional information, see “Description of Capital Stock—Registration Rights.” The terms of these purchases were the same for all purchasers of our Series F preferred stock. See “Principal Stockholders” for more details regarding the shares held by these entities.
The following table summarizes the Series F preferred stock purchased by members of our board of directors or their affiliates and holders of more than five percent of our outstanding capital stock:
| Name of Related Party |
Shares of Series F Preferred Stock |
Total Purchase Price | ||||||
| Tiger Global Private Investment Partners VII, L.P.(1) |
10,561,641 | $ | 25,650,001 | |||||
| Affiliates of T. Rowe Price New Horizons Fund, Inc.(2) |
7,411,678 | 18,000,001 | ||||||
| Affiliates of Draper Fisher Jurvetson Fund IX. L.P.(3) |
631,222 | 1,532,986 | ||||||
| Affiliates of Greylock XII Limited Partnership(4) |
424,536 | 1,031,028 | ||||||
| Globespan Capital Partners V, L.P.(5) |
243,982 | 592,535 | ||||||
| Annox Capital, LLC(6) |
200,000 | 485,720 | ||||||
| Austin Ligon |
29,141 | 70,772 | ||||||
| Selina Tobaccowala |
20,587 | 49,998 | ||||||
| (1) | Tiger Global Private Investment Partners VII, L.P. and its affiliates beneficially own more than five percent of our capital stock. |
| (2) | T. Rowe Price New Horizons Fund, Inc. and its affiliates beneficially own more than five percent of our capital stock. |
| (3) | Draper Fisher Jurvetson Fund IX, L.P. and its affiliates beneficially own more than five percent of our capital stock. |
| (4) | Greylock XII Limited Partnership and its affiliates beneficially own more than five percent of our capital stock. James Slavet, a member of our board of directors, is a general partner of Greylock Partners. |
| (5) | Andrew Goldfarb, a member of our board of directors, is the executive managing director of Globespan Management Associates V, LLC, or Globespan LLC, which is the sole general partner of Globespan Management Associates V, L.P., or Globespan L.P., which is the sole general partner of Globespan Capital Partners V, L.P., or Globespan, and has sole voting and dispositive power over the shares held by Globespan. |
| (6) | Robert Mylod, a member of our board of directors, is Managing Member of Annox Capital, LLC. |
2014 Third-Party Tender Offer
In December 2013, we entered into a letter agreement with certain holders of our capital stock pursuant to which we agreed to waive certain transfer restrictions in connection with, and assist in the administration of, a tender offer that such holders proposed to commence. In December 2013, these holders commenced a tender offer to purchase shares of our outstanding capital stock at a price per share of $2.4286, less transaction costs, pursuant to an offer to purchase to which we were not a party.
Adam Wiener, an executive officer, sold shares of our capital stock in the tender offer, which closed in January 2014.
An aggregate of 1,621,076 shares of our capital stock were tendered pursuant to the tender offer, of which Tiger Global Private Investment Partners VII, L.P. purchased 1,540,023 shares for an aggregate purchase price of $3,740,100. Tiger Global Private Investment Partners VII, L.P. and its affiliates is a beneficial holder of more than five percent of our outstanding capital stock.
105
Amended and Restated Investors’ Rights Agreement
We have entered into an amended and restated investors’ rights agreement with certain holders of our redeemable convertible preferred stock, including entities with which certain of our executive officers and directors are affiliated. These stockholders are entitled to rights with respect to the registration of their shares following this offering. For a description of these registration rights, see “Description of Capital Stock—Registration Rights.”
Indemnification Agreements
In connection with this offering, we intend to enter into amended and restated indemnification agreements with each of our directors and executive officers. The indemnification agreements, our restated certificate of incorporation and our restated bylaws, which will become effective immediately prior to the completion of this offering, will require us to indemnify our directors to the fullest extent not prohibited by Delaware law. Subject to certain limitations, our restated bylaws will also require us to advance expenses incurred by our directors and officers. For more information regarding these agreements, see “Executive Compensation—Limitations on Liability and Indemnification Matters.”
Review, Approval or Ratification of Transactions with Related Parties
Our written related party transactions policy and the charters of our audit committee and nominating and corporate governance committee to be adopted by our board of directors and in effect immediately prior to the completion of this offering will require that any transaction with a related person that must be reported under applicable rules of the SEC must be reviewed and approved or ratified by our audit committee, unless the related party is, or is associated with, a member of that committee, in which event the transaction must be reviewed and approved by our nominating and corporate governance committee.
Prior to this offering we had no formal, written policy or procedure for the review and approval of related party transactions. However, our practice has been to have all related party transactions reviewed and approved by a majority of the disinterested members of our board of directors, including the transactions described above.
106
The following table presents certain information with respect to the beneficial ownership of our common stock, and as adjusted to reflect the sale of common stock offered by us in this offering assuming no exercise of the underwriters’ option to purchase additional shares of our common stock, by:
| • | each of our directors; |
| • | each of our named executive officers; |
| • | all of our directors and executive officers as a group; and |
| • | each stockholder known by us to be the beneficial owner of more than five percent of our outstanding shares of common stock. |
We have determined beneficial ownership in accordance with the rules of the Securities and Exchange Commission. Unless otherwise indicated below, to our knowledge, based on information furnished to us, the persons and entities named in the table have sole voting and investment power with respect to all shares that they beneficially own, subject to applicable community property laws. We have deemed shares of our common stock subject to options that are currently exercisable or exercisable within 60 days of December 31, 2016 to be outstanding and to be beneficially owned by the person holding the option for the purpose of computing the percentage ownership of that person but have not treated them as outstanding for the purpose of computing the percentage ownership of any other person.
We have based percentage ownership of our common stock before this offering on 210,327,920 shares of our common stock outstanding on December 31, 2016, which includes conversion of all outstanding shares of our redeemable convertible preferred stock in connection with this offering, as if this conversion had occurred as of December 31, 2016. Percentage ownership of our common stock after this offering also assumes the sale by us of shares of common stock in this offering. Unless otherwise indicated, the address of each beneficial owner in the table below is c/o Redfin Corporation, 1099 Stewart St., Suite 600, Seattle, Washington 98101.
| Beneficial Ownership Prior to this Offering |
Beneficial Ownership After this Offering |
|||||||||||||||
| Name of Beneficial Owner |
Number | Percent | Number | Percent | ||||||||||||
| Directors and Named Executive Officers: |
||||||||||||||||
| Glenn Kelman(1) |
7,551,355 | 3.6 | % | % | ||||||||||||
| Bridget Frey(2) |
1,791,059 | * | ||||||||||||||
| Scott Nagel(3) |
2,119,210 | 1.0 | ||||||||||||||
| Robert Bass(4) |
33,333 | * | ||||||||||||||
| Julie Bornstein(5) |
25,000 | * | ||||||||||||||
| Andrew Goldfarb(6) |
8,312,402 | 4.0 | ||||||||||||||
| Paul Goodrich(7) |
24,108,079 | 11.5 | ||||||||||||||
| Austin Ligon(8) |
1,936,520 | 1.0 | ||||||||||||||
| Robert Mylod(9) |
1,381,437 | * | ||||||||||||||
| James Slavet(10) |
26,240,568 | 12.5 | ||||||||||||||
| Selina Tobaccowala(11) |
251,837 | * | ||||||||||||||
| All executive officers and directors as a group (13 persons)(12) |
78,042,872 | 35.5 | ||||||||||||||
| Other 5% Stockholders: |
||||||||||||||||
| Entities affiliated with Madrona Ventures(7) |
24,108,079 | 11.5 | ||||||||||||||
| Entities affiliated with Greylock XII Funds(10) |
26,240,568 | 12.5 | ||||||||||||||
| Entities affiliated with Draper Fisher Jurvetson(13) |
21,505,724 | 10.2 | ||||||||||||||
| Entities affiliated with Tiger Global Private Investment Partners Funds(14) |
22,102,338 | 10.5 | ||||||||||||||
| Entities affiliated with Vulcan Capital Venture Capital I LLC(15) |
21,122,722 | 10.0 | ||||||||||||||
| Entities affiliated with T. Rowe Price(16) |
14,825,865 | 7.0 | ||||||||||||||
107
| * | Represents beneficial ownership of less than one percent. |
| (1) | Represents (a) 5,968,330 shares of common stock and (b) 1,583,025 shares underlying options to purchase common stock that are exercisable within 60 days of December 31, 2016. |
| (2) | Represents (a) 111,250 shares of common stock and (b) 1,679,809 shares underlying options to purchase common stock that are exercisable within 60 days of December 31, 2016. |
| (3) | Represents (a) 25,000 shares of common stock and (b) 2,094,210 shares underlying options to purchase common stock that are exercisable within 60 days of December 31, 2016. |
| (4) | Represents 33,333 shares underlying options to purchase common stock that are exercisable within 60 days of December 31, 2016. |
| (5) | Represents 25,000 shares underlying options to purchase common stock that are exercisable within 60 days of December 31, 2016. |
| (6) | Represents shares of common stock held by Globespan Capital Partners V, L.P., or Globespan. Andrew Goldfarb, a member of our board of directors, is the executive managing director of Globespan Management Associates V, LLC, or Globespan LLC, which is the sole general partner of Globespan Management Associates V, L.P., or Globespan L.P., which is the sole general partner of Globespan, and has sole voting and dispositive power over the shares held by Globespan. The address of Globespan is 1 Boston Place, Suite 2810, Boston, Massachusetts 02108. |
| (7) | Represents (a) 22,746,780 shares of common stock held by Madrona Venture Fund III, L.P., or Madrona Fund III, and (b) 1,361,299 shares of common stock held by Madrona Venture Fund III-A, L.P., or Madrona Fund III-A. Paul Goodrich, a member of our board of directors, Tom Alberg, Matt McIlwain, Tim Porter, Scott Jacobson and Len Jordan are the managing directors of Madrona III General Partner, LLC, or Madrona LLC, which is the general partner of Madrona Investment Partners III, L.P., or Madrona Partners, which in turn is the general partner of each of Madrona Fund III and Madrona Fund III-A. Messrs. Goodrich, Alberg, McIlwain, Porter, Jacobson and Jordan have shared voting and dispositive power over the shares held by Madrona Fund III and Madrona Fund III-A. The address of Madrona Venture Group is 999 Third Avenue, 34th Floor, Seattle, Washington 98104. |
| (8) | Represents (a) (i) 228,158 shares of common stock and (ii) 43,827 shares underlying options to purchase common stock that are exercisable within 60 days of December 31, 2016 and (b) 1,664,535 shares of common stock held by Toon Toot Sawan LP, or Toon Toot. Austin Ligon, a member of our board of directors, is the managing member of Tewda Management LLC, which is the general partner of Toon Toot, and has sole voting and investment control over the shares held by Toon Toot. |
| (9) | Represents (a) 308,333 shares underlying options to purchase common stock that are exercisable within 60 days of December 31, 2016 and (b) 1,073,104 shares of common stock held by Annox Capital LLC, or Annox. Robert J. Mylod, a member of our board of directors, is the managing member of Annox and has sole voting and investment control over the shares held by Annox. |
| (10) | Represents (a) 22,435,687 shares of common stock held by Greylock XII Limited Partnership, or Greylock XII, (b) 2,492,854 shares of common stock held by Greylock XII-A Limited Partnership, or Greylock XII-A, and (c) 1,312,027 shares held by Greylock XII Principals LLC, or Greylock XII Principals. Greylock XII GP Limited Liability Company, or Greylock GP, is the general partner of each of Greylock XII and Greylock XII-A, and Greylock Management Corporation, or Greylock Management, is the sole member of Greylock XII Principals. James Slavet, a member of our board of directors, is a managing member of Greylock GP, and William W. Helman and Aneel Busri are the senior managing members of Greylock GP, and each of them may be deemed to share voting and investment control over the shares held by each of Greylock XII and Greylock XII-A. The shares held by Greylock XII Principals are held in nominee form only and Greylock XII Principals does not have voting or investment control over the shares that it holds. The address of Greylock Partners is 2550 Sand Hill Road, Suite 200, Menlo Park, California 94025. |
| (11) | Represents (a) 20,587 shares of common stock and (b) 231,250 shares underlying options to purchase common stock that are exercisable within 60 days of December 31, 2016. |
| (12) | Represents (a) 68,680,972 shares of common stock and (b) 9,361,900 shares underlying options to purchase common stock that are exercisable within 60 days of December 31, 2016. |
| (13) | Represents (a) 676,438 shares of common stock held by Draper Associates, L.P., (b) 22,858 shares of common stock held by Draper Associates Riskmasters Fund II, LLC, (c) 21,146 shares of common stock held by Draper Associates Riskmasters Fund III, LLC, (d) 20,236,887 shares of common stock held by Draper Fisher Jurvetson Fund IX, L.P. and (e) 548,395 shares held by Draper Fisher Jurvetson Partners IX, LLC. The address of DFJ Venture Capital is 2882 Sand Hill Road, Suite 150, Menlo Park, California 94025. |
| (14) | Represents (a) 19,235,314 shares of common stock held by Tiger Global Private Investment Partners VII, L.P. and (b) 2,867,024 shares held by Tiger Global Private Investment Partners IX, L.P. The address of Tiger Capital Management is 9 West 57th Street, New York, New York 10019. |
| (15) | Represents (a) 1,290,164 shares of common stock held by VCVC III LLC and (b) 19,832,558 shares of common stock held by Vulcan Capital Venture Capital I LLC. The address of Vulcan Capital is 505 Fifth Avenue, Suite 900, Seattle, Washington 98104. |
| (16) | Represents (a) 1,163,412 shares held by Amidspeed & Co., (b) 11,887,744 shares held by Bridge & Co., (c) 1,625,142 shares held by Heirloom & Co., (d) 23,436 shares held by Icecold & Co., and (e) 126,131 shares held by Mac & Co. The address of T. Rowe Price is 100 East Pratt Street, Baltimore, MD 21202. |
108
The following description summarizes the most important terms of our capital stock, as they will be in effect upon the completion of this offering. Because it is only a summary, it does not contain all the information that may be important to you. We expect to adopt a restated certificate of incorporation and restated bylaws that will become effective immediately prior to the completion of this offering, and this description summarizes provisions that are expected to be included in these documents. For a complete description, you should refer to our restated certificate of incorporation and restated bylaws, which are included as exhibits to the registration statement of which this prospectus forms a part, and to the applicable provisions of Delaware law.
Upon the completion of this offering, our authorized capital stock will consist of shares of common stock, $0.001 par value per share, and shares of undesignated preferred stock, $0.001 par value per share.
Assuming the conversion of all outstanding shares of our redeemable convertible preferred stock into shares of our common stock, which will occur upon the completion of this offering, as of December 31, 2016, there were outstanding 210,327,920 shares of our common stock, held by approximately 430 stockholders of record, and 39,876,938 shares of our common stock issuable upon exercise of outstanding stock options.
Common Stock
Dividend Rights
Subject to preferences that may apply to any shares of preferred stock outstanding at the time, the holders of our common stock are entitled to receive dividends out of funds legally available if our board of directors, in its discretion, determines to issue dividends and then only at the times and in the amounts that our board of directors may determine. See “Dividend Policy” for additional information.
Voting Rights
Holders of our common stock are entitled to one vote for each share held on all matters submitted to a vote of stockholders. Our restated certificate of incorporation that will become effective upon the completion of this offering does not provide for cumulative voting for the election of directors. As a result, the holders of a majority of our voting shares can elect all of the directors then standing for election. Our restated certificate of incorporation that will become effective upon the completion of this offering will establish a classified board of directors, to be divided into three classes with staggered three-year terms. Only one class of directors will be elected at each annual meeting of our stockholders, with the other classes continuing for the remainder of their respective three-year terms.
No Preemptive or Similar Rights
Our common stock is not entitled to preemptive rights, and is not subject to redemption or sinking fund provisions.
Right to Receive Liquidation Distributions
Upon our liquidation, dissolution or winding-up, the assets legally available for distribution to our stockholders would be distributable ratably among the holders of our common stock and any participating preferred stock outstanding at that time, subject to prior satisfaction of all outstanding debt and liabilities and the preferential rights of and the payment of liquidation preferences, if any, on any outstanding shares of preferred stock.
109
Preferred Stock
Pursuant to the provisions of our current certificate of incorporation, each currently-outstanding share of redeemable convertible preferred stock will automatically be converted into one share of common stock upon the completion of this offering. Following this offering, no shares of redeemable convertible preferred stock will be outstanding.
Pursuant to our restated certificate of incorporation that will become effective immediately prior to the completion of this offering, our board of directors will be authorized, subject to limitations prescribed by Delaware law, to issue preferred stock in one or more series, to establish from time to time the number of shares to be included in each series, and to fix the designation, powers, preferences, and rights of the shares of each series and any of its qualifications, limitations, or restrictions, in each case without further vote or action by our stockholders. Our board of directors can also increase or decrease the number of shares of any series of preferred stock, but not below the number of shares of that series then outstanding, without any further vote or action by our stockholders. Our board of directors may authorize the issuance of preferred stock with voting or conversion rights that could adversely affect the voting power or other rights of the holders of our common stock. The issuance of preferred stock, while providing flexibility in connection with possible acquisitions and other corporate purposes, could, among other things, have the effect of delaying, deferring, or preventing a change in our control and might adversely affect the market price of our common stock and the voting and other rights of the holders of our common stock. We have no current plan to issue any shares of preferred stock.
Stock Options
As of December 31, 2016, we had outstanding options to purchase an aggregate of 39,876,938 shares of our common stock, with a weighted-average exercise price of $1.95 per share, pursuant to our Amended and Restated 2004 Equity Incentive Plan.
Registration Rights
Following the completion of this offering, the holders of an aggregate of 174,837,426 shares of our common stock issuable upon conversion of our redeemable convertible preferred stock, or their permitted transferees, will be entitled to rights with respect to the registration of these shares under the Securities Act. These shares are referred to as registrable securities. These rights are provided under the terms of our Amended and Restated Investors’ Rights Agreement, or IRA, dated as of December 15, 2014, between us and the holders of these registrable securities, which registration rights include demand registration rights, Form S-3 registration rights, and piggyback registration rights. All fees, costs, and expenses incurred in connection with the registration of registrable securities, including reasonable fees and disbursements of one special counsel to the selling stockholders up to $25,000, will be borne by us and all selling expenses, including underwriting discounts and selling commissions, will be borne by the holders of the shares being registered.
The registration rights terminate upon the earliest of (1) five years following the completion of this offering, (2) as to each holder of registration rights, when such holder can sell all of such holder’s registrable securities during a three-month period pursuant to Rule 144 promulgated under the Securities Act, and (3) when the IRA is terminated pursuant to its terms.
Demand Registration Rights
Under the terms of the IRA, if we receive a written request, at any time after six months following the effective date of this offering, from the holders of at least 20% of the registrable securities
110
then outstanding (or any lesser percentage if the aggregate proceeds after deducting underwriting discounts and commissions is not less than $5.0 million) that we file a registration statement under the Securities Act covering the registration of registrable securities, then we will be required to use our best efforts to file as soon as practicable, and in any event no later than 90 days following such request, a registration statement covering all registrable securities requested to be registered for public resale. We are required to effect only two registrations pursuant to this provision of the IRA, and may postpone the filing of a registration statement for up to 90 days once in any 12-month period if our board of directors determines that the filing would be seriously detrimental to us and our stockholders. We are also not required to effect a demand registration under certain additional circumstances specified in the IRA, including at any time during the 180-day period after the effective date of this offering.
Form S-3 Registration Rights
The holders of registrable securities can request that we register all or part of their shares on Form S-3 if we are eligible to file a registration statement on Form S-3 and if the aggregate price to the public of the shares offered (net of any underwriters’ discounts or commissions) is at least $1.0 million. We are required to effect no more than two registrations on Form S-3 in any 12-month period, and may postpone the filing of a registration statement on Form S-3 for up to 60 days once in any 12-month period if our board of directors determines that the filing would be seriously detrimental to us and our stockholders. We are not required to file a registration statement on Form S-3 under certain additional circumstances specified in our IRA.
Piggyback Registration Rights
If we register any of our securities for public sale, each holder of registrable securities has a right to request the inclusion of any then-outstanding registrable securities held by them on our registration statement. However, this right does not apply to a registration relating solely to employee benefit plans, a corporate reorganization or stock issuable upon conversion of debt securities. If the underwriters of any underwritten offering determine in good faith that marketing factors require a limitation on the number of shares, the number of shares to be registered will be apportioned, first, to the company for its own account and, second, pro rata among these holders, based on the number of registrable securities held by each holder. However, the number of registrable securities to be registered cannot be reduced below 30% of the total shares covered by the registration statement, other than in the initial public offering.
Anti-Takeover Provisions
The provisions of Delaware and Washington law, our restated certificate of incorporation, and our restated bylaws, as we expect they will be in effect upon the completion of this offering, could have the effect of delaying, deferring, or discouraging another person from acquiring control of our company. These provisions, which are summarized below, may have the effect of discouraging takeover bids. They are also designed, in part, to encourage persons seeking to acquire control of us to negotiate first with our board of directors. We believe that the benefits of increased protection of our potential ability to negotiate with an unfriendly or unsolicited acquirer outweigh the disadvantages of discouraging a proposal to acquire us because negotiation of these proposals could result in an improvement of their terms.
Delaware Law
We are subject to the provisions of Section 203 of the Delaware General Corporation Law, or DGCL, regulating corporate takeovers. In general, DGCL Section 203 prohibits a publicly held
111
Delaware corporation from engaging in a business combination with an interested stockholder for a period of three years following the date on which the person became an interested stockholder unless:
| • | prior to the date of the transaction, the board of directors of the corporation approved either the business combination or the transaction which resulted in the stockholder becoming an interested stockholder; |
| • | the interested stockholder owned at least 85% of the voting stock of the corporation outstanding at the time the transaction commenced, excluding for purposes of determining the voting stock outstanding, but not the outstanding voting stock owned by the interested stockholder, (1) shares owned by persons who are directors and also officers and (2) shares owned by employee stock plans in which employee participants do not have the right to determine confidentially whether shares held subject to the plan will be tendered in a tender or exchange offer; or |
| • | at or subsequent to the date of the transaction, the business combination is approved by the board of directors of the corporation and authorized at an annual or special meeting of stockholders, and not by written consent, by the affirmative vote of at least 66.67% of the outstanding voting stock that is not owned by the interested stockholder. |
Generally, a business combination includes a merger, asset or stock sale, or other transaction or series of transactions together resulting in a financial benefit to the interested stockholder. An interested stockholder is a person who, together with affiliates and associates, owns or, within three years prior to the determination of interested stockholder status, did own 15% or more of a corporation’s outstanding voting stock. We expect the existence of this provision to have an anti-takeover effect with respect to transactions our board of directors does not approve in advance. We also anticipate that DGCL Section 203 may also discourage attempts that might result in a premium over the market price for the shares of common stock held by stockholders.
Washington Law
Furthermore, we may also be subject to the provisions of Chapter 23B.19 of the Washington Business Corporation Act, or WBCA, which imposes restrictions on certain transactions between a corporation and certain significant stockholders. The WBCA generally prohibits a “target corporation” (as defined in the WBCA) from engaging in certain significant business transactions with an “acquiring person,” which is defined as a person or group of persons that beneficially owns 10% or more of the voting securities of the target corporation, for a period of five years after such acquisition, unless the transaction or acquisition of shares is approved by a majority of the members of the target corporation’s board of directors prior to the time of the acquisition or at or subsequent to the acquiring person’s share acquisition time, such significant business transaction is approved by a majority of the members of the target corporation’s board of directors and authorized at an annual or special meeting of stockholders by the affirmative vote of at least 66-2/3% of the outstanding voting shares, except for shares beneficially owned by or under the voting control of the acquiring person. Such prohibited transactions include, among other things:
| • | a merger or consolidation with, disposition of assets to, or issuance or redemption of stock to or from the acquiring person; |
| • | termination of 5% or more of the employees of the target corporation as a result of the acquiring person’s acquisition of 10% or more of the shares; or |
| • | allowing the acquiring person to receive any disproportionate benefit as a stockholder. |
112
After the five-year period, a “significant business transaction” may occur if it complies with “fair price” provisions specified in the statute. A corporation may not opt out of this statute and, therefore, we anticipate this statute will apply to us. Depending upon whether we meet the definition of a target corporation, Chapter 23B.19 of the Washington Business Corporation Act may have the effect of delaying, deferring or preventing a change in control.
Restated Certificate of Incorporation and Restated Bylaw Provisions
Our restated certificate of incorporation and our restated bylaws will include a number of provisions that could deter hostile takeovers or delay or prevent changes in control of our management team, including the following:
| • | Board of Directors Vacancies. Our restated certificate of incorporation and restated bylaws will authorize only our board of directors to fill vacant directorships, including newly created seats. In addition, the number of directors constituting our board of directors is permitted to be set only by a resolution adopted by a majority vote of our entire board of directors. These provisions would prevent a stockholder from increasing the size of our board of directors and then gaining control of our board of directors by filling the resulting vacancies with its own nominees. This makes it more difficult to change the composition of our board of directors but promotes continuity of management. |
| • | Classified Board. Our restated certificate of incorporation and restated bylaws will provide that our board of directors will be classified into three classes of directors. The existence of a classified board of directors could discourage a third-party from making a tender offer or otherwise attempting to obtain control of us as it is more difficult and time consuming for stockholders to replace a majority of the directors on a classified board of directors. See “Management—Board of Directors Composition” for additional information. |
| • | Stockholder Action; Special Meeting of Stockholders. Our restated certificate of incorporation provides that special meetings of our stockholders may be called only by a majority of our board of directors, the chairman of our board of directors, our chief executive officer, or our president. Our restated certificate of incorporation will provide that our stockholders may not take action by written consent, but may only take action at annual or special meetings of our stockholders. As a result, holders of our capital stock would not be able to amend our restated bylaws or remove directors without holding a meeting of our stockholders called in accordance with our restated bylaws. Further, our restated bylaws will provide that special meetings of our stockholders may be called only by a majority of our board of directors, the chairman of our board of directors, our lead independent director, our Chief Executive Officer, or our President, thus prohibiting a stockholder from calling a special meeting. These provisions might delay the ability of our stockholders to force consideration of a proposal or for stockholders to take any action, including the removal of directors. |
| • | Advance Notice Requirements for Stockholder Proposals and Director Nominations. Our restated bylaws provide advance notice procedures for stockholders seeking to bring business before our annual meeting of stockholders or to nominate candidates for election as directors at our annual meeting of stockholders. Our restated bylaws also specify certain requirements regarding the form and content of a stockholder’s notice. These provisions might preclude our stockholders from bringing matters before our annual meeting of stockholders or from making nominations for directors at our annual meeting of stockholders if the proper procedures are not followed. We expect that these provisions might also discourage or deter a potential acquirer from conducting a solicitation of proxies to elect the acquirer’s own slate of directors or otherwise attempting to obtain control of our company. |
113
| • | No Cumulative Voting. The DGCL provides that stockholders are not entitled to the right to cumulate votes in the election of directors unless a corporation’s certificate of incorporation provides otherwise. Our restated certificate of incorporation and restated bylaws will not provide for cumulative voting. |
| • | Directors Removed Only for Cause. Our restated certificate of incorporation will provide that stockholders may remove directors only for cause and only by the affirmative vote of the holders of at least two-thirds of our outstanding common stock. |
| • | Amendment of Charter Provisions. Any amendment of the above expected provisions in our restated certificate of incorporation would require approval by holders of at least two-thirds of our outstanding common stock. |
| • | Issuance of Undesignated Preferred Stock. After the filing of our restated certificate of incorporation, our board of directors will have the authority, without further action by the stockholders, to issue up to shares of undesignated preferred stock with rights and preferences, including voting rights, designated from time to time by our board of directors. The existence of authorized but unissued shares of preferred stock enables our board of directors to render more difficult or to discourage an attempt to obtain control of us by means of a merger, tender offer, proxy contest, or other means. |
| • | Choice of forum. Our restated certificate of incorporation will provide that the Court of Chancery of the State of Delaware will be the exclusive forum for any derivative action or proceeding brought on our behalf; any action asserting a breach of fiduciary duty; any action asserting a claim against us arising pursuant to the DGCL, our restated certificate of incorporation or our restated bylaws; or any action asserting a claim against us that is governed by the internal affairs doctrine. |
Listing
We intend to apply to list our common stock on the under the symbol “RDFN.”
Transfer Agent and Registrar
The transfer agent and registrar for our common stock is . The transfer agent’s address is , and its telephone number is .
114
SHARES ELIGIBLE FOR FUTURE SALE
Prior to this offering, there has been no public market for shares of our common stock, and we cannot predict the effect, if any, that market sales of shares of our common stock or the availability of shares of our common stock for sale will have on the market price of our common stock prevailing from time to time. Nevertheless, sales of substantial amounts of our common stock, including shares issued upon exercise of outstanding stock options, in the public market following this offering could adversely affect market prices prevailing from time to time and could impair our ability to raise capital through the sale of our equity securities.
Upon the completion of this offering, based on the number of shares of our capital stock outstanding as of December 31, 2016, we will have a total of shares of our common stock outstanding. Of these outstanding shares, all of the shares of common stock sold in this offering will be freely tradable, except that any shares purchased in this offering by our affiliates, as that term is defined in Rule 144 under the Securities Act, would only be able to be sold in compliance with the Rule 144 limitations described below.
The remaining outstanding shares of our common stock will be deemed “restricted securities” as defined in Rule 144 under the Securities Act. Restricted securities may be sold in the public market only if they are registered under the Securities Act or if they qualify for an exemption from registration under Rule 144 or Rule 701 under the Securities Act, which rules are summarized below. In addition, most of our security holders have entered into agreements with us containing market standoff provisions or lock-up agreements with the underwriters under which they have agreed, subject to specific exceptions, not to sell any of our stock for at least 180 days following the date of this prospectus, as described below. As a result of these agreements, subject to the provisions of Rule 144 or Rule 701, shares will be available for sale in the public market as follows:
| • | beginning on the date of this prospectus, all of the shares sold in this offering will be immediately available for sale in the public market; |
| • | beginning 181 days after the date of this prospectus, additional shares will become eligible for sale in the public market, of which shares will be held by affiliates and subject to the volume and other restrictions of Rule 144, as described below; and |
| • | the remainder of the shares will be eligible for sale in the public market from time to time thereafter upon subject to vesting and, in some cases, to the volume and other restrictions of Rule 144, as described below. |
Lock-Up Agreements and Market Stand-off Provisions
All of our directors, officers and most of our security holders are subject to lock-up agreements or market stand-off provisions that, subject to exceptions described under “Underwriting” below, prohibit them from offering for sale, selling, contracting to sell, pledging, granting any option for the sale of, making any short sale of, transferring or otherwise disposing of any shares of our common stock, stock options, or any security or instrument related to this common stock, or stock option for a period of at least 180 days following the date of this prospectus, without the prior written consent of the underwriters. These agreements are subject to certain customary exceptions. See “Underwriting” for additional information.
Rule 144
In general, under Rule 144, as currently in effect, once we have been subject to the public company reporting requirements for at least 90 days, a person who is not deemed to have been one of
115
our affiliates for purposes of the Securities Act at any time during the 90 days preceding a sale and who has beneficially owned the shares proposed to be sold for at least six months, including the holding period of any prior owner other than our affiliates, is entitled to sell those shares without complying with the manner of sale, volume limitation or notice provisions of Rule 144, subject to compliance with the public information requirements of Rule 144. If such a person has beneficially owned the shares proposed to be sold for at least one year, including the holding period of any prior owner other than our affiliates, then that person would be entitled to sell those shares without complying with any of the requirements of Rule 144.
In general, under Rule 144, as currently in effect, our affiliates or persons selling shares on behalf of our affiliates are entitled to sell upon expiration of the lock-up and market stand-off provisions described above, within any three-month period, a number of shares that does not exceed the greater of:
| • | 1% of the number of shares of our common stock then outstanding, which will equal approximately shares immediately after this offering; or |
| • | the average weekly trading volume of our common stock during the four calendar weeks preceding the filing of a notice on Form 144 with respect to that sale. |
Sales under Rule 144 by our affiliates or persons selling shares on behalf of our affiliates are also subject to certain manner of sale provisions and notice requirements and to the availability of current public information about us.
Rule 701
Rule 701 generally allows a stockholder who purchased shares of our capital stock pursuant to a written compensatory plan or contract and who is not deemed to have been an affiliate of our company during the immediately preceding 90 days to sell these shares in reliance upon Rule 144, but without being required to comply with the public information, holding period, volume limitation, or notice provisions of Rule 144. Rule 701 also permits affiliates of our company to sell their Rule 701 shares under Rule 144 without complying with the holding period requirements of Rule 144. All holders of Rule 701 shares, however, are required by that rule to wait until 90 days after the date of this prospectus before selling those shares pursuant to Rule 701. Moreover, all Rule 701 shares are subject to lock-up agreements or market stand-off provisions as described above and under “Underwriting” and will not become eligible for sale until the expiration of those agreements.
Registration Statement
In connection with this offering, we intend to file a registration statement on Form S-8 under the Securities Act registering the issuance and sale of all of the shares of our common stock subject to outstanding options and the shares of our common stock reserved for issuance under our equity incentive plans. We expect to file this registration statement as soon as permitted under the Securities Act. However, the shares registered on Form S-8 may be subject to the volume limitations and the manner of sale, notice and public information requirements of Rule 144 and will not be eligible for resale until expiration of the lock-up and market stand-off agreements to which they are subject.
Registration Rights
We have granted demand, Form S-3, and piggyback registration rights to certain of our stockholders to sell our common stock. Registration of the sale of these shares under the Securities Act would result in these shares becoming freely tradable without restriction under the Securities Act immediately upon the effectiveness of the related registration statement, except for shares purchased by affiliates. See “Description of Capital Stock—Registration Rights” for additional information.
116
MATERIAL U.S. FEDERAL TAX CONSEQUENCES
TO NON-U.S. HOLDERS OF OUR COMMON STOCK
The following summary describes the material U.S. federal income tax considerations of the acquisition, ownership, and disposition of our common stock by “non-U.S. holders” (as described below under “—Non-U.S. Holder Defined”). This summary does not address all aspects of U.S. federal income tax considerations relating thereto. This summary also does not address the tax considerations arising under the laws of any non-U.S., state, or local jurisdiction, or under U.S. federal gift and estate tax laws, except to the limited extent provided below.
Special rules different from those described below may apply to certain non-U.S. holders that are subject to special treatment under the Code, including, without limitation:
| • | banks, insurance companies, or other financial institutions; |
| • | partnerships or entities or arrangements treated as partnerships or other pass-through entities for U.S. federal tax purposes (or investors in such entities); |
| • | corporations that accumulate earnings to avoid U.S. federal income tax; |
| • | persons subject to the alternative minimum tax or Medicare contribution tax; |
| • | tax-exempt entities (including private foundations) or tax-qualified retirement plans; |
| • | controlled foreign corporations or passive foreign investment companies; |
| • | persons who acquired our common stock as compensation for services; |
| • | dealers in securities or currencies; |
| • | traders in securities that elect to use a mark-to-market method of accounting for their securities holdings; |
| • | persons that own, or are deemed to own, more than five percent of our capital stock (except to the extent specifically set forth below); |
| • | U.S. expatriates and certain former citizens or long-term residents of the United States; |
| • | persons who hold our common stock as a position in a hedging transaction, “straddle,” “conversion transaction,” or other risk reduction transaction; |
| • | persons who do not hold our common stock as a capital asset within the meaning of Section 1221 of the Code (generally, for investment purposes); or |
| • | persons deemed to sell our common stock under the constructive sale provisions of the Code. |
In addition, if a partnership or an entity or an arrangement classified as a partnership or other pass-through entity for U.S. federal income tax purposes is a beneficial owner of our common stock, the tax treatment of a partner in the partnership or an owner of the entity will depend upon the status of the partner or other owner and the activities of the partnership or other entity. Therefore, this summary does not address tax considerations applicable to partnerships that hold our common stock, and partners in such partnerships should consult their tax advisors.
117
The information provided below is based upon provisions of the Code, Treasury regulations promulgated thereunder, administrative rulings and judicial decisions as of the date hereof. Such authorities may be subject to differing interpretations, repealed, revoked or modified, perhaps retroactively, so as to result in U.S. federal income tax consequences different from those discussed below. We have not requested a ruling from the Internal Revenue Service, or IRS, with respect to the statements made and the conclusions reached in the following summary, and there can be no assurance that the IRS will not take a contrary position regarding the tax consequences of the acquisition, ownership and disposition of our common stock, or that any such contrary position would not be sustained by a court. In either case, the tax considerations of owning or disposing of our common stock could differ from those described below and as a result, we cannot assure you that the tax consequences described in this discussion will not be challenged by the IRS or will be sustained by a court if challenged by the IRS.
INVESTORS CONSIDERING THE PURCHASE OF OUR COMMON STOCK SHOULD CONSULT THEIR OWN TAX ADVISORS REGARDING THE APPLICATION OF THE U.S. FEDERAL INCOME AND ESTATE TAX LAWS TO THEIR PARTICULAR SITUATIONS AND THE CONSEQUENCES OF FOREIGN, STATE OR LOCAL LAWS AND TAX TREATIES.
Non-U.S. Holder Defined
For purposes of this summary, a “non-U.S. holder” is any beneficial owner of our common stock, other than a partnership, that is not:
| • | an individual who is a citizen or resident of the United States (as determined under U.S. federal income tax rules); |
| • | a corporation, or other entity taxable as a corporation for U.S. federal income tax purposes, created or organized under the laws of the United States, any state therein or Washington, D.C.; |
| • | a trust if it (1) is subject to the primary supervision of a court within the United States and one of more U.S. persons have authority to control all substantial decisions of the trust or (2) has a valid election in effect under applicable U.S. Treasury regulations to be treated as a U.S. person; or |
| • | an estate whose income is subject to U.S. income tax regardless of its source. |
If you are a non-U.S. citizen that is an individual, you may, in some cases, be deemed to be a resident alien (as opposed to a nonresident alien) by virtue of being present in the United States for at least 31 days in the calendar year and for an aggregate of at least 183 days during a three-year period ending in the current calendar year. Generally, for this purpose, all the days you are present in the current year, one-third of the days you are present in the immediately preceding year and one-sixth of the days you are present in the second preceding year, are counted. Resident aliens are generally subject to U.S. federal income tax as if they were U.S. citizens. Such an individual is urged to consult his or her own tax advisor regarding the U.S. federal income tax consequences of the ownership or disposition of our common stock.
Distributions
We do not expect to declare or make any distributions on our common stock in the foreseeable future. If we do make distributions on our common stock, however, such distributions will generally constitute dividends for U.S. federal income tax purposes to the extent they are paid from our current
118
or accumulated earnings and profits, as determined under U.S. federal income tax principles. Distributions in excess of our current and accumulated earnings and profits will constitute a return of capital that is applied against and reduces, but not below zero, a non-U.S. holder’s adjusted tax basis in our common stock. Any remaining excess will be treated as gain realized on the sale or exchange of our common stock as described below under “—Gain on Disposition of our Common Stock.” The amount of any distribution of property other than cash will be the fair market value of that property on the date of distribution.
Any distribution on our common stock that is treated as a dividend paid to a non-U.S. holder that is not effectively connected with the non-U.S. holder’s conduct of a trade or business in the United States will generally be subject to U.S. withholding tax at a 30% rate or such lower rate as may be specified under the terms of an applicable income tax treaty between the United States and the non-U.S. holder’s country of residence. Non-U.S. holders should consult their tax advisors regarding their entitlement to benefits under a relevant income tax treaty. Generally, in order for us or our paying agent to withhold tax at a lower treaty rate, a non-U.S. holder must certify its entitlement to treaty benefits. A non-U.S. holder generally can meet this certification requirement by providing a properly executed Form W-8BEN or Form W-8BEN-E or appropriate substitute form to us or our paying agent. If the non-U.S. holder holds the stock through a financial institution or other agent acting on the holder’s behalf, the holder will be required to provide appropriate documentation to the agent. The holder’s agent will then be required to provide certification to us or our paying agent, either directly or through other intermediaries. A non-U.S. holder that is eligible for a reduced rate of U.S. federal withholding tax under an income tax treaty with the United States may obtain a refund or credit of any excess amounts withheld by filing an appropriate claim for a refund with the IRS in a timely manner.
Dividends received by a non-U.S. holder that are effectively connected with a U.S. trade or business conducted by the non-U.S. holder, and if required by an applicable income tax treaty between the United States and the non-U.S. holder’s country of residence, are attributable to a permanent establishment maintained by the non-U.S. holder in the United States, are not subject to U.S. withholding tax. To obtain this exemption, a non-U.S. holder must provide us or our paying agent with a properly executed IRS Form W-8ECI certifying such exemption. Such effectively connected dividends, although not subject to withholding tax, are taxed at the same graduated rates applicable to U.S. persons, net of certain deductions and credits. In addition to being taxed at graduated income tax rates, dividends received by corporate non-U.S. holders that are effectively connected with a U.S. trade or business of the corporate non-U.S. holder may also be subject to an additional “branch profits tax,” which is imposed, under certain circumstances, at a rate of 30% (or such lower rate as may be specified by an applicable tax treaty) on the corporate non-U.S. holder’s effectively connected earnings and profits, subject to certain adjustments.
For additional withholding rules that may apply to dividends paid to foreign financial institutions (as specifically defined by the applicable rules), or to non-financial foreign entities that have substantial direct or indirect U.S. owners, see “—Foreign Accounts.”
Gain on Disposition of our Common Stock
Subject to the discussions below under “—Backup Withholding and Information Reporting” and “—Foreign Accounts,” non-U.S. holders will generally not be subject to U.S. federal income tax on gain realized on the sale, exchange or other disposition of our common stock unless:
| (1) | the gain is effectively connected with the conduct by the non-U.S. holder of a U.S. trade or business and if required by an applicable income tax treaty between the United States and the non-U.S. holder’s country of residence, is attributable to a permanent establishment maintained by the non-U.S. holder in the United States; |
119
| (2) | the non-U.S. holder is a nonresident individual and is present in the United States for 183 days or more in the taxable year of the sale, exchange or other disposition of our common stock and certain other requirements are met; or |
| (3) | the rules of the Foreign Investment in Real Property Tax Act, or FIRPTA, apply to treat the gain as effectively connected with a U.S. trade or business. |
A non-U.S. holder described in (1) above will be required to pay tax on the net gain derived from the sale, exchange, or other disposition of our common stock at regular graduated U.S. federal income tax rates, unless a specific treaty exemption applies, and corporate non-U.S. holders described in (1) above may also be subject to the additional branch profits tax at a 30% rate or such lower rate as may be specified by an applicable income tax treaty.
An individual non-U.S. holder described in (2) above, will be required to pay a flat 30% tax on the gain derived from the sale, exchange or other disposition of our common stock, or such other reduced rate as may be specified by an applicable income tax treaty, which gain may be offset by U.S. source capital losses (even though the non-U.S. holder is not considered a resident of the United States).
With respect to (3) above, in general, the FIRPTA rules may apply to a sale, exchange, or other disposition of our common stock if we are, or were within the shorter of the five-year period preceding the disposition and the non-U.S. holder’s holding period, a U.S. real property holding corporation, or USRPHC. We do not believe that we are a USRPHC and we do not anticipate becoming a USRPHC in the future. Even if we become a USRPHC, gain realized by a non-U.S. holder on a disposition of our common stock will not be subject to U.S. federal income tax under FIRPTA as long as (a) our common stock is regularly traded on an established securities market and (b) the non-U.S. holder owned, directly, indirectly and constructively, no more than five percent of our outstanding common stock at all times within the shorter of (i) the five-year period preceding the disposition or (ii) the holder’s holding period.
For additional withholding rules that may apply to proceeds of a disposition of our common stock paid to foreign financial institutions (as specifically defined by the applicable rules), or to non-financial foreign entities that have substantial direct or indirect U.S. owners, see “—Foreign Accounts.”
U.S. Federal Estate Tax
The estates of nonresident alien individuals generally are subject to U.S. federal estate tax on property with a U.S. situs. Because we are a U.S. corporation, our common stock will be U.S. situs property and therefore will be included in the taxable estate of a nonresident alien decedent, unless an applicable estate tax treaty between the United States and the decedent’s country of residence provides otherwise. Investors are urged to consult their own tax advisors regarding the U.S. federal estate tax consequences of the ownership or disposition of our common stock.
Backup Withholding and Information Reporting
The Code and the Treasury regulations require those who make specified payments to report the payments to the IRS. Among the specified payments are dividends and proceeds paid by brokers to their customers. The required information returns enable the IRS to determine whether the recipient properly included the payments in income. This reporting regime is reinforced by “backup withholding” rules. These rules require the payors to withhold tax from payments subject to information reporting if the recipient fails to comply with the reporting requirements by failing to provide his taxpayer
120
identification number or other certification of exempt status to the payor, furnishing an incorrect identification number, or failing to report interest or dividends on his returns. The backup withholding tax rate is currently 28%. The backup withholding rules do not apply to payments to corporations, whether domestic or foreign, provided they establish such exemption.
Payments to non-U.S. holders of dividends on common stock generally will not be subject to backup withholding and payments of proceeds made to non-U.S. holders by a broker upon a sale of common stock will not be subject to information reporting or backup withholding, in each case so long as the non-U.S. holder certifies its nonresident status (and we or our paying agent do not have actual knowledge or reason to know the holder is a U.S. person or that the conditions of any other exemption are not, in fact, satisfied) or otherwise establishes an exemption. U.S. backup withholding generally will not apply to a non-U.S. holder who provides a properly executed IRS Form W-8BEN or IRS Form W-8BEN-E, or otherwise establishes an exemption. We must report annually to the IRS any dividends paid to each non-U.S. holder and the tax withheld, if any, with respect to these dividends. Copies of these reports may be made available to tax authorities in the country where the non-U.S. holder resides.
Under the Treasury regulations, the payment of proceeds from the disposition of shares of our common stock by a non-U.S. holder made to or through a U.S. office of a broker generally will be subject to information reporting and backup withholding unless the beneficial owner certifies, under penalties of perjury, among other things, its status as a non-U.S. holder (and the broker does not have actual knowledge or reason to know the holder is a U.S. person) or otherwise establishes an exemption. The payment of proceeds from the disposition of shares of our common stock by a non-U.S. holder made to or through a non-U.S. office of a broker generally will not be subject to backup withholding and information reporting, except as noted below. Information reporting, but not backup withholding, will apply to a payment of proceeds, even if that payment is made outside of the United States, if a non-U.S. holder sells our common stock through a non-U.S. office of a broker that is:
| • | a U.S. person (including a foreign branch or office of such person); |
| • | a “controlled foreign corporation” for U.S. federal income tax purposes; |
| • | a foreign person 50% or more of whose gross income from certain periods is effectively connected with a U.S. trade or business; or |
| • | a foreign partnership if at any time during its tax year (1) one or more of its partners are U.S. persons who, in the aggregate, hold more than 50% of the income or capital interests of the partnership or (2) the foreign partnership is engaged in a U.S. trade or business, |
unless the broker has documentary evidence that the beneficial owner is a non-U.S. holder and certain other conditions are satisfied, or the beneficial owner otherwise establishes an exemption (and the broker has no actual knowledge or reason to know to the contrary).
Backup withholding is not an additional tax. Any amounts withheld from a payment to a holder of common stock under the backup withholding rules can be credited against any U.S. federal income tax liability of the holder and may entitle the holder to a refund, provided that the required information is furnished to the IRS in a timely manner.
Foreign Accounts
In addition to, and separately from the withholding rules described above, U.S. federal withholding taxes may apply under the Foreign Account Tax Compliance Act, or FATCA, on certain
121
types of payments, including dividends and the gross proceeds of a disposition of our common stock, made to non-U.S. financial institutions and certain other non-U.S. entities. Specifically, a 30% withholding tax may be imposed on dividends on, or gross proceeds from the sale or other disposition of, our common stock paid to a “foreign financial institution” or a “non-financial foreign entity” (each as defined in the Code), unless (1) the foreign financial institution undertakes certain diligence and reporting obligations, (2) the non-financial foreign entity either certifies it does not have any “substantial United States owners” (as defined in the Code) or furnishes identifying information regarding each substantial United States owner, or (3) the foreign financial institution or non-financial foreign entity otherwise qualifies for an exemption from these rules. The 30% federal withholding tax described in this paragraph cannot be reduced under an income tax treaty with the United States. If the payee is a foreign financial institution and is subject to the diligence and reporting requirements in (1) above, it must enter into an agreement with the U.S. Department of the Treasury requiring, among other things, that it undertake to identify accounts held by certain “specified United States persons” or “United States-owned foreign entities” (each as defined in the Code), annually report certain information about such accounts, and withhold 30% on certain payments to non-compliant foreign financial institutions and certain other account holders. Foreign financial institutions located in jurisdictions that have an intergovernmental agreement with the United States governing FATCA may be subject to different rules.
Under applicable Treasury Regulations and IRS guidance, FATCA withholding as described above currently applies to payments of dividends on our common stock, and will also apply to payments of gross proceeds from the sale or other disposition of our common stock made on or after January 1, 2019.
PROSPECTIVE INVESTORS SHOULD CONSULT THEIR TAX ADVISORS REGARDING THE POTENTIAL APPLICATION OF WITHHOLDING UNDER FATCA TO THEIR INVESTMENT IN OUR COMMON STOCK. THE PRECEDING DISCUSSION OF U.S. FEDERAL TAX CONSIDERATIONS IS FOR GENERAL INFORMATION PURPOSES ONLY. IT IS NOT TAX ADVICE. EACH PROSPECTIVE INVESTOR SHOULD CONSULT ITS OWN TAX ADVISOR REGARDING THE PARTICULAR U.S. FEDERAL, GIFT, ESTATE, STATE, LOCAL, AND FOREIGN TAX CONSEQUENCES OF PURCHASING, HOLDING, AND DISPOSING OF OUR COMMON STOCK, INCLUDING THE CONSEQUENCES OF ANY PROPOSED CHANGE IN APPLICABLE LAWS.
122
We have entered into an underwriting agreement with Goldman, Sachs & Co. with respect to the shares being offered. Goldman, Sachs & Co. is the representative of the underwriters.
| Underwriters |
Number of Shares |
|||
| Goldman, Sachs & Co. |
||||
|
|
|
|||
| Total |
||||
|
|
|
|||
The underwriters will commit to take and pay for all of the shares being offered, if any are taken, other than the shares covered by the option described below unless and until this option is exercised.
The underwriters have an option to buy up to an additional shares from us. They may exercise that option for 30 days. If any shares are purchased pursuant to this option, the underwriters will severally purchase shares in approximately the same proportion as set forth in the table above.
The following table shows the per share and total underwriting discount to be paid to the underwriters by us. Such amounts are shown assuming both no exercise and full exercise of the underwriters’ option to purchase additional shares.
| No Exercise | Full Exercise | |||||||
| Per Share |
$ | $ | ||||||
| Total |
$ | $ | ||||||
Shares sold by the underwriters to the public will initially be offered at the initial public offering price set forth on the cover page of this prospectus. Any shares sold by the underwriters to securities dealers may be sold at a discount of up to $ per share from the initial public offering price. After the initial offering of the shares, the representatives may change the offering price and the other selling terms. The offering of the shares by the underwriters is subject to receipt and acceptance and subject to the underwriters’ right to reject any order in whole or in part.
We and our officers, directors, and holders of substantially all of our common stock and securities convertible into or exchangeable for our common stock, have agreed with the underwriters, subject to certain exceptions, not to dispose of or hedge any of our or their common stock or securities convertible into or exchangeable for shares of common stock during the period from the date of this prospectus continuing through the date 180 days after the date of this prospectus, except with the prior written consent of Goldman, Sachs & Co. See “Shares Eligible for Future Sale” for a discussion of certain transfer restrictions.
Prior to this offering, there has been no public market for the shares. The initial public offering price will be negotiated among us and the representatives. Among the factors to be considered in determining the initial public offering price of the shares, in addition to prevailing market conditions, were our historical performance, estimates of the business potential and earnings prospects of our company, an assessment of our management and the consideration of the above factors in relation to market valuation of companies in related businesses.
Our common stock will be listed on under the symbol “RDFN.”
In connection with this offering, the underwriters may purchase and sell shares of common stock in the open market. These transactions may include short sales, stabilizing transactions and
123
purchases to cover positions created by short sales. Short sales involve the sale by the underwriters of a greater number of shares than they are required to purchase in this offering, and a short position represents the amount of such sales that have not been covered by subsequent purchases. A “covered short position” is a short position that is not greater than the amount of additional shares for which the underwriters’ option described above may be exercised. The underwriters may cover any covered short position by either exercising their option to purchase additional shares or purchasing shares in the open market. In determining the source of shares to cover the covered short position, the underwriters will consider, among other things, the price of shares available for purchase in the open market as compared to the price at which they may purchase additional shares pursuant to the option described above. “Naked” short sales are any short sales that create a short position greater than the amount of additional shares for which the option described above may be exercised. The underwriters must cover any such naked short position by purchasing shares in the open market. A naked short position is more likely to be created if the underwriters are concerned that there may be downward pressure on the price of the common stock in the open market after pricing that could adversely affect investors who purchase in this offering. Stabilizing transactions consist of various bids for or purchases of common stock made by the underwriters in the open market prior to the completion of this offering.
The underwriters may also impose a penalty bid. This occurs when a particular underwriter repays to the underwriters a portion of the underwriting discount received by it because the representatives have repurchased shares sold by or for the account of such underwriter in stabilizing or short covering transactions.
Purchases to cover a short position and stabilizing transactions, as well as other purchases by the underwriters for their own accounts, may have the effect of preventing or retarding a decline in the market price of our common stock, and together with the imposition of the penalty bid, may stabilize, maintain, or otherwise affect the market price of our common stock. As a result, the price of our common stock may be higher than the price that otherwise might exist in the open market. The underwriters are not required to engage in these activities and may end any of these activities at any time. These transactions may be effected on the , in the over-the-counter market or otherwise.
The underwriters do not expect sales to discretionary accounts to exceed five percent of the total number of shares offered.
We estimate that our share of the total expenses of the offering, excluding the underwriting discount, will be approximately $ million.
We have agreed to indemnify the underwriters against certain liabilities, including liabilities under the Securities Act.
The underwriters and their respective affiliates are full service financial institutions engaged in various activities, which may include sales and trading, commercial and investment banking, advisory, investment management, investment research, principal investment, hedging, market making, brokerage, and other financial and non-financial activities and services. Certain of the underwriters and their respective affiliates have provided, and may in the future provide, a variety of these services to us and to persons and entities with relationships with us, for which they received or will receive customary fees and expenses.
In the ordinary course of their various business activities, the underwriters and their respective affiliates, officers, directors, and employees may purchase, sell, or hold a broad array of investments and actively trade securities, derivatives, loans, commodities, currencies, credit default swaps, and other financial instruments for their own account and for the accounts of their customers, and such
124
investment and trading activities may involve or relate to assets, securities, or instruments of the issuer (directly, as collateral securing other obligations or otherwise), or persons and entities with relationships with the issuer. The underwriters and their respective affiliates may also communicate independent investment recommendations, market color, or trading ideas or publish or express independent research views in respect of such assets, securities, or instruments and may at any time hold, or recommend to clients that they should acquire, long or short positions in such assets, securities and instruments.
European Economic Area
In relation to each Member State of the European Economic Area which has implemented the Prospectus Directive, each, a Relevant Member State, each underwriter has represented and agreed that with effect from and including the date on which the Prospectus Directive is implemented in that Relevant Member State, or the Relevant Implementation Date, it has not made and will not make an offer of shares to the public in that Relevant Member State prior to the publication of a prospectus in relation to the shares which has been approved by the competent authority in that Relevant Member State or, where appropriate, approved in another Relevant Member State and notified to the competent authority in that Relevant Member State, all in accordance with the Prospectus Directive, except that it may, with effect from and including the Relevant Implementation Date, make an offer of shares to the public in that Relevant Member State at any time:
| (1) | to legal entities which are authorized or regulated to operate in the financial markets or, if not so authorized or regulated, whose corporate purpose is solely to invest in securities; |
| (2) | to any legal entity which has two or more of: (a) an average of at least 250 employees during the last financial year; (b) a total balance sheet of more than € 43.0 million; and (c) an annual net turnover of more than € 50.0 million, as shown in its last annual or consolidated accounts; |
| (3) | to fewer than 100 natural or legal persons (other than qualified investors as defined in the Prospectus Directive) subject to obtaining the prior consent of the representatives for any such offer; or |
| (4) | in any other circumstances which do not require the publication by the Issuer of a prospectus pursuant to Article 3 of the Prospectus Directive. |
For the purposes of this provision, the expression an “offer of shares to the public” in relation to any shares in any Relevant Member State means the communication in any form and by any means of sufficient information on the terms of the offer and the shares to be offered so as to enable an investor to decide to purchase or subscribe the shares, as the same may be varied in that Relevant Member State by any measure implementing the Prospectus Directive in that Relevant Member State and the expression Prospectus Directive means Directive 2003/71/EC and includes any relevant implementing measure in each Relevant Member State.
United Kingdom
Each underwriter has represented and agreed that:
| (1) | it has only communicated or caused to be communicated and will only communicate or cause to be communicated an invitation or inducement to engage in investment activity (within the meaning of Section 21 of the Financial Services and Markets Act 2000, or FSMA) received by it in connection with the issue or sale of the shares in circumstances in which Section 21(1) of the FSMA does not apply to the Issuer; and |
125
| (2) | it has complied and will comply with all applicable provisions of the FSMA with respect to anything done by it in relation to the shares in, from or otherwise involving the United Kingdom. |
Hong Kong
The shares may not be offered or sold by means of any document other than (1) in circumstances which do not constitute an offer to the public within the meaning of the Companies Ordinance (Cap. 32, Laws of Hong Kong), or (2) to “professional investors” within the meaning of the Securities and Futures Ordinance (Cap. 571, Laws of Hong Kong) and any rules made thereunder, or (3) in other circumstances which do not result in the document being a “prospectus” within the meaning of the Companies Ordinance (Cap. 32, Laws of Hong Kong), and no advertisement, invitation or document relating to the shares may be issued or may be in the possession of any person for the purpose of issue (in each case whether in Hong Kong or elsewhere), which is directed at, or the contents of which are likely to be accessed or read by, the public in Hong Kong (except if permitted to do so under the laws of Hong Kong) other than with respect to shares which are or are intended to be disposed of only to persons outside Hong Kong or only to “professional investors” within the meaning of the Securities and Futures Ordinance (Cap. 571, Laws of Hong Kong) and any rules made thereunder.
Singapore
This prospectus has not been registered as a prospectus with the Monetary Authority of Singapore. Accordingly, this prospectus and any other document or material in connection with the offer or sale, or invitation for subscription or purchase, of the shares may not be circulated or distributed, nor may the shares be offered or sold, or be made the subject of an invitation for subscription or purchase, whether directly or indirectly, to persons in Singapore other than (1) to an institutional investor under Section 274 of the Securities and Futures Act, Chapter 289 of Singapore or the SFA, (2) to a relevant person, or any person pursuant to Section 275(1A), and in accordance with the conditions, specified in Section 275 of the SFA, or (3) otherwise pursuant to, and in accordance with the conditions of, any other applicable provision of the SFA.
Where the shares are subscribed or purchased under Section 275 by a relevant person which is: (1) a corporation (which is not an accredited investor) the sole business of which is to hold investments and the entire share capital of which is owned by one or more individuals, each of whom is an accredited investor; or (2) a trust (where the trustee is not an accredited investor) whose sole purpose is to hold investments and each beneficiary is an accredited investor, shares, debentures and units of shares and debentures of that corporation or the beneficiaries’ rights and interest in that trust shall not be transferable for 6 months after that corporation or that trust has acquired the shares under Section 275 except: (a) to an institutional investor under Section 274 of the SFA or to a relevant person, or any person pursuant to Section 275(1A), and in accordance with the conditions, specified in Section 275 of the SFA; (b) where no consideration is given for the transfer; or (c) by operation of law.
Japan
The securities have not been and will not be registered under the Financial Instruments and Exchange Act of Japan (Act No. 25 of 1948, as amended), or the FIEA. The securities may not be offered or sold, directly or indirectly, in Japan or to or for the benefit of any resident of Japan (including any person resident in Japan or any corporation or other entity organized under the laws of Japan) or to others for re-offering or resale, directly or indirectly, in Japan or to or for the benefit of any resident of Japan, except pursuant to an exemption from the registration requirements of the FIEA and otherwise in compliance with any relevant laws and regulations of Japan.
126
Canada
The securities may be sold only to purchasers purchasing, or deemed to be purchasing, as principal that are accredited investors, as defined in National Instrument 45-106 Prospectus Exemptions or subsection 73.3(1) of the Securities Act (Ontario), and are permitted clients, as defined in National Instrument 31-103 Registration Requirements, Exemptions and Ongoing Registrant Obligations. Any resale of the securities must be made in accordance with an exemption from, or in a transaction not subject to, the prospectus requirements of applicable securities laws.
Securities legislation in certain provinces or territories of Canada may provide a purchaser with remedies for rescission or damages if this prospectus (including any amendment thereto) contains a misrepresentation, provided that the remedies for rescission or damages are exercised by the purchaser within the time limit prescribed by the securities legislation of the purchaser’s province or territory. The purchaser should refer to any applicable provisions of the securities legislation of the purchaser’s province or territory for particulars of these rights or consult with a legal advisor.
Pursuant to section 3A.3 (or, in the case of securities issued or guaranteed by the government of a non-Canadian jurisdiction, section 3A.4) of National Instrument 33-105 Underwriting Conflicts, or NI 33-105, the underwriters are not required to comply with the disclosure requirements of NI 33-105 regarding underwriter conflicts of interest in connection with this offering.
127
Fenwick & West LLP, Seattle, Washington, has acted as our counsel in connection with this offering and will pass upon the validity of the issuance of the shares of our common stock offered by this prospectus. Cooley LLP, Seattle, Washington, is representing the underwriters.
The consolidated financial statements as of December 31, 2014 and 2015 and for each of the two years in the period ended December 31, 2015, included in this prospectus have been audited by Deloitte & Touche LLP, an independent registered public accounting firm, as stated in their report appearing herein and elsewhere in the registration statement. Such consolidated financial statements have been so included in reliance upon the report of such firm given upon their authority as experts in accounting and auditing.
WHERE YOU CAN FIND ADDITIONAL INFORMATION
We have filed with the SEC a registration statement on Form S-1 under the Securities Act with respect to the shares of common stock offered hereby. This prospectus, which constitutes a part of the registration statement, does not contain all of the information set forth in the registration statement or the exhibits filed therewith. For further information about us and our common stock offered hereby, reference is made to the registration statement and the exhibits filed therewith. Statements contained in this prospectus regarding the contents of any contract or any other document that is filed as an exhibit to the registration statement are not necessarily complete, and in each instance we refer you to the copy of such contract or other document filed as an exhibit to the registration statement. We currently do not file periodic reports with the SEC. Upon the completion of this public offering, we will be required to file periodic reports, proxy statements and other information with the SEC pursuant to the Exchange Act. A copy of the registration statement and the exhibits filed therewith may be inspected without charge at the public reference room maintained by the SEC, located at 100 F Street, NE, Washington, D.C. 20549, and copies of all or any part of the registration statement may be obtained from that office. Please call the SEC at 1-800-SEC-0330 for further information about the public reference room. The SEC also maintains a website that contains reports, proxy and information statements, and other information regarding registrants that file electronically with the SEC. The address of the website is www.sec.gov. We also maintain a website at www.redfin.com, at which you may access these materials free of charge as soon as reasonably practicable after they are electronically filed with, or furnished to, the SEC. Information contained on our website is not a part of this prospectus and the inclusion of our website address in this prospectus is an inactive textual reference only.
128
INDEX TO CONSOLIDATED FINANCIAL STATEMENTS
| Page | ||||
| F-2 | ||||
| F-3 | ||||
| F-4 | ||||
| F-5 | ||||
| F-6 | ||||
| F-7 | ||||
F-1
REPORT OF INDEPENDENT REGISTERED PUBLIC ACCOUNTING FIRM
To the Board of Directors and Stockholders of
Redfin Corporation
Seattle, Washington
We have audited the accompanying consolidated balance sheets of Redfin Corporation and its subsidiaries (the “Company”) as of December 31, 2014 and 2015, and the related consolidated statements of operations, changes in redeemable convertible preferred stock and stockholders’ deficit, and cash flows for the years then ended. These consolidated financial statements are the responsibility of the Company’s management. Our responsibility is to express an opinion on these consolidated financial statements based on our audits.
We conducted our audits in accordance with the standards of the Public Company Accounting Oversight Board (United States) and in accordance with auditing standards generally accepted in the United States of America. Those standards require that we plan and perform the audit to obtain reasonable assurance about whether the consolidated financial statements are free of material misstatement. The Company is not required to have, nor were we engaged to perform, an audit of its internal control over financial reporting. Our audits included consideration of internal control over financial reporting as a basis for designing audit procedures that are appropriate in the circumstances, but not for the purpose of expressing an opinion on the effectiveness of the Company’s internal control over financial reporting. Accordingly, we express no such opinion. An audit also includes examining, on a test basis, evidence supporting the amounts and disclosures in the consolidated financial statements, assessing the accounting principles used and significant estimates made by management, as well as evaluating the overall financial statement presentation. We believe that our audits provide a reasonable basis for our opinion.
In our opinion, such consolidated financial statements present fairly, in all material respects, the financial position of Redfin Corporation and its subsidiaries as of December 31, 2014 and 2015, and the results of their operations and their cash flows for the years then ended in conformity with accounting principles generally accepted in the United States of America.
/s/ Deloitte & Touche LLP
Seattle, Washington
February 3, 2017
F-2
Redfin Corporation and Subsidiaries
Consolidated Balance Sheets
(in thousands, except share and per share amounts)
| December 31, | September 30, | Pro Forma September 30, |
||||||||||||||
| 2014 | 2015 | 2016 | 2016 | |||||||||||||
| (unaudited) | ||||||||||||||||
| Assets: |
||||||||||||||||
| Current assets: |
||||||||||||||||
| Cash and cash equivalents |
$ | 110,601 | $ | 85,597 | $ | 75,027 | ||||||||||
| Restricted cash |
1,663 | 3,423 | 6,795 | |||||||||||||
| Short-term investments |
1,526 | 1,744 | 1,744 | |||||||||||||
| Prepaid expenses |
2,669 | 6,632 | 3,877 | |||||||||||||
| Accrued revenue, net |
2,919 | 5,604 | 11,027 | |||||||||||||
| Other current assets |
729 | 10 | 1,846 | |||||||||||||
|
|
|
|
|
|
|
|||||||||||
| Total current assets |
120,107 | 103,010 | 100,316 | |||||||||||||
| Property and equipment, net |
6,630 | 7,378 | 8,385 | |||||||||||||
| Intangible assets, net |
4,758 | 4,270 | 3,904 | |||||||||||||
| Goodwill |
9,186 | 9,186 | 9,186 | |||||||||||||
| Other assets |
1,432 | 1,210 | 7,163 | |||||||||||||
|
|
|
|
|
|
|
|||||||||||
| Total assets: |
$ | 142,113 | $ | 125,054 | $ | 128,954 | ||||||||||
|
|
|
|
|
|
|
|||||||||||
| Liabilities, redeemable convertible preferred stock and stockholders’ equity (deficit): |
||||||||||||||||
| Current liabilities: |
||||||||||||||||
| Accounts payable |
$ | 1,337 | $ | 1,490 | $ | 3,347 | ||||||||||
| Accrued liabilities |
11,001 | 14,892 | 21,978 | |||||||||||||
| Other payables |
1,573 | 3,394 | 6,756 | |||||||||||||
| Current portion of deferred rent |
— | — | 1,612 | |||||||||||||
|
|
|
|
|
|
|
|||||||||||
| Total current liabilities |
13,911 | 19,776 | 33,693 | |||||||||||||
| Deferred rent, net of current portion |
1,098 | 1,077 | 1,235 | |||||||||||||
|
|
|
|
|
|
|
|||||||||||
| Total liabilities |
15,009 | 20,853 | 34,928 | |||||||||||||
|
|
|
|
|
|
|
|||||||||||
| Commitments and contingencies (note 9) |
||||||||||||||||
| Redeemable convertible preferred stock—par value $0.001 per share; 166,266,114 shares authorized, issued and outstanding; and aggregate liquidation preference of $167,488 |
497,699 | 599,914 | 543,095 | — | ||||||||||||
|
|
|
|
|
|
|
|
|
|||||||||
| Stockholders’ equity (deficit) |
||||||||||||||||
| Common stock—par value $0.001 per share; 255,000,000, 255,000,000 and 290,081,638 shares authorized, respectively; 37,888,896, 42,179,400 and 43,534,572 shares issued and outstanding, respectively |
38 | 42 | 44 | 210 | ||||||||||||
| Additional paid-in capital |
— | — | 37,962 | 201,958 | ||||||||||||
| Accumulated deficit |
(370,633 | ) | (495,755 | ) | (487,075 | ) | (108,142 | ) | ||||||||
|
|
|
|
|
|
|
|
|
|||||||||
| Total stockholders’ equity (deficit) |
(370,595 | ) | (495,713 | ) | (449,069 | ) | 94,026 | |||||||||
|
|
|
|
|
|
|
|
|
|||||||||
| Total liabilities, redeemable convertible preferred stock and stockholders’ equity (deficit): |
$ | 142,113 | $ | 125,054 | $ | 128,954 | ||||||||||
|
|
|
|
|
|
|
|||||||||||
The accompanying notes are an integral part of these consolidated financial statements.
F-3
Redfin Corporation and Subsidiaries
Consolidated Statements of Operations
(in thousands, except share and per share amounts)
| Year Ended December 31, | Nine Months Ended September 30, |
|||||||||||||||
| 2014 | 2015 | 2015 | 2016 | |||||||||||||
| (unaudited) | ||||||||||||||||
| Revenue |
$ | 125,363 | $ | 187,338 | $ | 141,605 | $ | 200,414 | ||||||||
| Cost of revenue |
93,272 | 138,492 | 103,474 | 138,955 | ||||||||||||
|
|
|
|
|
|
|
|
|
|||||||||
| Gross profit |
32,091 | 48,846 | 38,131 | 61,459 | ||||||||||||
|
|
|
|
|
|
|
|
|
|||||||||
| Operating expenses: |
||||||||||||||||
| Technology and development |
17,876 | 27,842 | 20,383 | 25,739 | ||||||||||||
| Marketing |
15,058 | 19,899 | 15,011 | 23,133 | ||||||||||||
| General and administrative |
24,240 | 31,394 | 24,237 | 29,948 | ||||||||||||
|
|
|
|
|
|
|
|
|
|||||||||
| Total operating expenses |
57,174 | 79,135 | 59,631 | 78,820 | ||||||||||||
|
|
|
|
|
|
|
|
|
|||||||||
| Income (loss) from operations |
(25,083 | ) | (30,289 | ) | (21,500 | ) | (17,361 | ) | ||||||||
|
|
|
|
|
|
|
|
|
|||||||||
| Interest income and other income, net: |
||||||||||||||||
| Interest income |
23 | 46 | 27 | 133 | ||||||||||||
| Other income, net |
24 | 7 | 8 | 37 | ||||||||||||
|
|
|
|
|
|
|
|
|
|||||||||
| Total interest income and other income, net |
47 | 53 | 35 | 170 | ||||||||||||
|
|
|
|
|
|
|
|
|
|||||||||
| Income (loss) before tax benefit (expense) |
(25,036 | ) | (30,236 | ) | (21,465 | ) | (17,191 | ) | ||||||||
| Income tax benefit (expense) |
306 | — | — | — | ||||||||||||
|
|
|
|
|
|
|
|
|
|||||||||
| Net income (loss) |
$ | (24,730 | ) | $ | (30,236 | ) | $ | (21,465 | ) | $ | (17,191 | ) | ||||
|
|
|
|
|
|
|
|
|
|||||||||
| Accretion of redeemable convertible preferred stock |
(101,251 | ) | (102,224 | ) | (48,811 | ) | 56,819 | |||||||||
| Undistributed earnings attributable to participating securities |
— | — | — | (31,483 | ) | |||||||||||
|
|
|
|
|
|
|
|
|
|||||||||
| Net income (loss) attributable to common stock—basic |
$ | (125,981 | ) | $ | (132,460 | ) | $ | (70,276 | ) | $ | 8,145 | |||||
|
|
|
|
|
|
|
|
|
|||||||||
| Net income (loss) attributable to common stock—diluted |
$ | (125,981 | ) | $ | (132,460 | ) | $ | (70,276 | ) | $ | (17,191 | ) | ||||
|
|
|
|
|
|
|
|
|
|||||||||
| Net income (loss) per share attributable to common stock—basic |
$ | (3.92 | ) | $ | (3.29 | ) | $ | (1.77 | ) | $ | 0.19 | |||||
|
|
|
|
|
|
|
|
|
|||||||||
| Net income (loss) per share attributable to common stock—diluted |
$ | (3.92 | ) | $ | (3.29 | ) | $ | (1.77 | ) | $ | (0.08 | ) | ||||
|
|
|
|
|
|
|
|
|
|||||||||
| Weighted average shares used to compute net income (loss) per share attributable to common stock—basic |
32,150,025 | 40,249,762 | 39,669,071 | 43,017,478 | ||||||||||||
|
|
|
|
|
|
|
|
|
|||||||||
| Weighted average shares used to compute net income (loss) per share attributable to common stock—diluted |
32,150,025 | 40,249,762 | 39,669,071 | 209,288,537 | ||||||||||||
|
|
|
|
|
|
|
|
|
|||||||||
| Pro forma net income (loss) per share attributable to common stock—basic and diluted (unaudited) |
$ | (0.15 | ) | $ | (0.08 | ) | ||||||||||
|
|
|
|
|
|||||||||||||
| Pro forma weighted-average shares used to compute net income (loss) per share attributable to common stock—basic and diluted (unaudited) |
206,515,876 | 209,283,592 | ||||||||||||||
|
|
|
|
|
|||||||||||||
The accompanying notes are an integral part of these consolidated financial statements.
F-4
Redfin Corporation and Subsidiaries
Consolidated Statements of Cash Flows
(in thousands)
| Year Ended December 31, |
Nine Months Ended September 30, |
|||||||||||||||
| 2014 | 2015 | 2015 | 2016 | |||||||||||||
| (unaudited) | ||||||||||||||||
| Operating activities |
||||||||||||||||
| Net income (loss) |
$ | (24,730 | ) | $ | (30,236 | ) | $ | (21,465 | ) | $ | (17,191 | ) | ||||
| Adjustments to reconcile net income (loss) to net cash used in operating activities: |
||||||||||||||||
| Depreciation and amortization |
2,672 | 4,395 | 3,089 | 4,532 | ||||||||||||
| Stock-based compensation |
5,196 | 5,562 | 4,045 | 5,890 | ||||||||||||
| Tax benefit from business acquisition |
(306 | ) | — | — | — | |||||||||||
| Change in assets and liabilities: |
||||||||||||||||
| Restricted cash |
275 | (1,761 | ) | (3,856 | ) | (3,371 | ) | |||||||||
| Prepaid expenses |
(726 | ) | (3,963 | ) | (55 | ) | 2,755 | |||||||||
| Accrued revenue |
499 | (2,685 | ) | (2,327 | ) | (5,423 | ) | |||||||||
| Other current assets |
(120 | ) | 721 | 716 | (1,838 | ) | ||||||||||
| Other long-term assets |
(474 | ) | (36 | ) | (51 | ) | (5,953 | ) | ||||||||
| Accounts payable |
913 | 152 | (602 | ) | 1,858 | |||||||||||
| Accrued expenses |
3,412 | 3,890 | 4,938 | 7,086 | ||||||||||||
| Other payables |
(322 | ) | 1,822 | 3,908 | 3,362 | |||||||||||
| Deferred lease liability |
115 | (21 | ) | (64 | ) | 1,770 | ||||||||||
|
|
|
|
|
|
|
|
|
|||||||||
| Net cash used in operating activities |
(13,596 | ) | (22,160 | ) | (11,724 | ) | (6,523 | ) | ||||||||
|
|
|
|
|
|
|
|
|
|||||||||
| Investing activities |
||||||||||||||||
| Maturities of short-term investments |
1,477 | 1,590 | 1,526 | 1,744 | ||||||||||||
| Purchases of short-term investments |
(1,481 | ) | (1,550 | ) | (1,526 | ) | (1,744 | ) | ||||||||
| Acquisition of business, net of cash acquired |
(4,074 | ) | — | — | — | |||||||||||
| Purchases of property and equipment |
(4,961 | ) | (4,607 | ) | (4,133 | ) | (5,116 | ) | ||||||||
|
|
|
|
|
|
|
|
|
|||||||||
| Net cash used in investing activities |
(9,039 | ) | (4,567 | ) | (4,133 | ) | (5,116 | ) | ||||||||
|
|
|
|
|
|
|
|
|
|||||||||
| Financing activities |
||||||||||||||||
| Proceeds from issuance of redeemable convertible preferred stock |
71,517 | — | — | — | ||||||||||||
| Issuance costs of redeemable convertible preferred stock |
(2,928 | ) | (9 | ) | (9 | ) | — | |||||||||
| Proceeds from tender offer |
225 | 2,659 | 2,659 | — | ||||||||||||
| In-substance dividend paid in relation to tender offer |
(225 | ) | (2,659 | ) | (2,659 | ) | — | |||||||||
| Proceeds from exercise of stock options |
996 | 1,732 | 1,558 | 1,069 | ||||||||||||
|
|
|
|
|
|
|
|
|
|||||||||
| Net cash provided by financing activities |
69,585 | 1,723 | 1,549 | 1,069 | ||||||||||||
|
|
|
|
|
|
|
|
|
|||||||||
| Net change in cash and cash equivalents |
46,950 | (25,004 | ) | (14,308 | ) | (10,570 | ) | |||||||||
| Cash and cash equivalents: |
||||||||||||||||
| Beginning of period |
63,651 | 110,601 | 110,601 | 85,597 | ||||||||||||
|
|
|
|
|
|
|
|
|
|||||||||
| End of period |
$ | 110,601 | $ | 85,597 | $ | 96,293 | $ | 75,027 | ||||||||
|
|
|
|
|
|
|
|
|
|||||||||
| Supplemental disclosure of non-cash investing and financial activities |
||||||||||||||||
| Fair value of common stock issued for acquisition of business |
$ | (8,520 | ) | $ | — | $ | — | $ | — | |||||||
| Reversal of treasury stock receivable |
$ | (1,170 | ) | $ | — | $ | — | $ | — | |||||||
| Accretion of redeemable convertible preferred stock |
$ | (101,251 | ) | $ | (102,224 | ) | $ | (48,811 | ) | $ | 56,819 | |||||
| Stock-based compensation capitalized in property and equipment |
$ | — | $ | (49 | ) | $ | (39 | ) | $ | (57 | ) | |||||
The accompanying notes are an integral part of these consolidated financial statements.
F-5
Redfin Corporation and Subsidiaries
Consolidated Statements of Changes in Redeemable Convertible Preferred Stock and Stockholders’ Deficit
(in thousands, except for shares)
| Redeemable Convertible Preferred Stock |
Common Stock | Additional Paid-in Capital |
Treasury Stock Receivable |
Accumulated Deficit |
Total Stockholders’ Deficit |
|||||||||||||||||||||||||||||||||||||||
| Shares | Amount | Shares | Amount | Shares | Amount | |||||||||||||||||||||||||||||||||||||||
| Balance, January 1, 2014 |
144,518,151 | $ | 327,859 | 27,587,129 | $ | 28 | $ | — | 2,924,500 | $ | (1,170 | ) | $ | (259,887 | ) | $ | (261,029 | ) | ||||||||||||||||||||||||||
| Exercise of stock options |
— | — | 5,301,436 | 5 | 1,523 | — | — | — | 1,528 | |||||||||||||||||||||||||||||||||||
| Issuance of redeemable convertible preferred stock—net of issuance costs of $2,928 |
21,747,963 | 68,589 | — | — | — | — | — | — | — | |||||||||||||||||||||||||||||||||||
| Stock-based compensation |
— | — | — | — | 5,196 | — | — | — | 5,196 | |||||||||||||||||||||||||||||||||||
| In-substance dividend issued in tender offer |
— | — | — | — | 225 | — | — | (225 | ) | — | ||||||||||||||||||||||||||||||||||
| Issuance of common stock in business acquisition |
— | — | 4,000,331 | 4 | 8,516 | — | — | — | 8,520 | |||||||||||||||||||||||||||||||||||
| Treasury stock modification into common shares |
— | — | 1,000,000 | 1 | — | (2,924,500 | ) | 1,170 | — | 1,171 | ||||||||||||||||||||||||||||||||||
| Accretion of redeemable convertible preferred stock |
— | 101,251 | — | — | (15,460 | ) | — | — | (85,791 | ) | (101,251 | ) | ||||||||||||||||||||||||||||||||
| Net income (loss) |
— | — | — | — | — | — | — | (24,730 | ) | (24,730 | ) | |||||||||||||||||||||||||||||||||
|
|
|
|
|
|
|
|
|
|
|
|
|
|
|
|
|
|
|
|||||||||||||||||||||||||||
| Balance, December 31, 2014 |
166,266,114 | $ | 497,699 | 37,888,896 | $ | 38 | $ | — | — | $ | — | $ | (370,633 | ) | $ | (370,595 | ) | |||||||||||||||||||||||||||
|
|
|
|
|
|
|
|
|
|
|
|
|
|
|
|
|
|
|
|||||||||||||||||||||||||||
| Exercise of stock options |
— | — | 4,290,504 | $ | 4 | $ | 1,727 | — | — | — | $ | 1,731 | ||||||||||||||||||||||||||||||||
| Redeemable convertible preferred stock issuance costs |
— | $ | (9 | ) | — | — | — | — | — | — | — | |||||||||||||||||||||||||||||||||
| Stock-based compensation |
— | — | 5,611 | — | — | — | 5,611 | |||||||||||||||||||||||||||||||||||||
| In-substance dividend issued in tender offer |
— | — | — | — | 2,659 | — | — | $ | (2,659 | ) | — | |||||||||||||||||||||||||||||||||
| Accretion of redeemable convertible preferred stock |
— | 102,224 | — | — | (9,997 | ) | — | — | (92,227 | ) | (102,224 | ) | ||||||||||||||||||||||||||||||||
| Net income (loss) |
— | — | — | — | — | — | — | (30,236 | ) | (30,236 | ) | |||||||||||||||||||||||||||||||||
|
|
|
|
|
|
|
|
|
|
|
|
|
|
|
|
|
|
|
|||||||||||||||||||||||||||
| Balance, December 31, 2015 |
166,266,114 | $ | 599,914 | 42,179,400 | $ | 42 | $ | — | — | $ | — | $ | (495,755 | ) | $ | (495,713 | ) | |||||||||||||||||||||||||||
|
|
|
|
|
|
|
|
|
|
|
|
|
|
|
|
|
|
|
|||||||||||||||||||||||||||
| Exercise of stock options (unaudited) |
— | — | 1,355,172 | $ | 2 | $ | 1,067 | — | — | — | $ | 1,069 | ||||||||||||||||||||||||||||||||
| Stock-based compensation (unaudited) |
— | — | — | — | 5,947 | — | — | — | 5,947 | |||||||||||||||||||||||||||||||||||
| Accretion of redeemable convertible preferred stock (unaudited) |
— | $ | (56,819 | ) | — | — | 30,948 | — | — | $ | 25,871 | 56,819 | ||||||||||||||||||||||||||||||||
| Net income (loss) (unaudited) |
— | — | — | — | — | — | — | (17,191 | ) | (17,191 | ) | |||||||||||||||||||||||||||||||||
|
|
|
|
|
|
|
|
|
|
|
|
|
|
|
|
|
|
|
|||||||||||||||||||||||||||
| Balance, September 30, 2016 (unaudited) |
166,266,114 | $ | 543,095 | 43,534,572 | $ | 44 | $ | 37,962 | — | $ | — | $ | (487,075 | ) | $ | (449,069 | ) | |||||||||||||||||||||||||||
|
|
|
|
|
|
|
|
|
|
|
|
|
|
|
|
|
|
|
|||||||||||||||||||||||||||
The accompanying notes are an integral part of these consolidated financial statements.
F-6
Redfin Corporation and Subsidiaries
Notes to Consolidated Financial Statements
(information as of September 30, 2016 and for the nine months
ended September 30, 2015 and 2016 is unaudited)
Note 1: Description of Business and Summary of Significant Accounting Policies:
Description of Business—Redfin Corporation (“Redfin” or the “Company”) was incorporated in October 2002 and is headquartered in Seattle, Washington. The Company operates an online real estate marketplace and provides real estate services, including assisting individuals to purchase or sell their residential property. The Company has operations located in multiple states nationwide.
Basis of Presentation—The consolidated financial statements and accompanying notes have been prepared in accordance with accounting principles generally accepted in the United States of America, or GAAP. The Company had no components of other comprehensive income (loss) during any of the periods presented, as such, a consolidated statement of comprehensive income (loss) is not presented. All amounts are presented in thousands, except share and per share data.
Principles of Consolidation—The consolidated financial statements include the accounts of Redfin and its wholly owned subsidiaries. Intercompany transactions and balances have been eliminated.
Certain Significant Risks and Business Uncertainties—The Company is subject to the risks and challenges associated with companies at a similar stage of development. These include dependence on key individuals, successful development and marketing of its offerings, and competition with larger companies with greater financial, technical, and marketing resources. Further, during the period required to achieve substantially higher revenue in order to become profitable, the Company may require additional funds that may not be readily available or may not be on terms that are acceptable to the Company.
The Company operates in the online real estate marketplace and, accordingly, can be affected by a variety of factors. For example, management of the Company believes that any of the following factors could have a significant negative effect on the Company’s future financial position, results of operations, and cash flows: unanticipated fluctuations in operating results due to seasonality and cyclicality in the real estate industry, changes in home sale prices and transaction volumes, the Company’s ability to increase market share, competition and U.S. economic conditions.
Use of Estimates—The preparation of consolidated financial statements, in conformity with GAAP, requires management to make estimates and assumptions that affect the reported amounts of assets and liabilities and disclosures at the date of the financial statements during the reporting period. The Company’s more significant estimates include but are not limited to valuation of deferred income taxes, stock-based compensation, fair value of common stock and redeemable convertible preferred stock, capitalization of website development costs, recoverability of intangible assets with finite lives, and the fair value of reporting units for purposes of evaluating goodwill for impairment. The amounts ultimately realized from the affected assets or ultimately recognized as liabilities will depend on, among other factors, general business conditions and could differ materially in the near term from the carrying amounts reflected in the consolidated financial statements.
Unaudited Interim Financial Information—The consolidated financial statements and all disclosures as of September 30, 2016 and for the nine months ended September 30, 2015 and 2016 are unaudited. These unaudited interim consolidated financial statements have been prepared on the same basis as the annual consolidated financial statements and, in the opinion of management, reflect
F-7
Redfin Corporation and Subsidiaries
Notes to Consolidated Financial Statements—(Continued)
(information as of September 30, 2016 and for the nine months
ended September 30, 2015 and 2016 is unaudited)
all normal recurring adjustments necessary for a fair statement of the Company’s financial position as of September 30, 2016 and results of operations and cash flows for the nine months ended September 30, 2015 and 2016. The results of operations for the nine months ended September 30, 2016 are not necessarily indicative of the results to be expected for 2016 or for other interim periods or for future periods.
Unaudited Pro Forma Consolidated Balance Sheet Data and Unaudited Pro Forma Net Income (Loss) per Share Attributable to Common Stock—The unaudited pro forma information has been prepared assuming that, upon the completion of the public offering contemplated by us, all of the Company’s redeemable convertible preferred stock outstanding will automatically convert into shares of common stock, based on the provisions in the Company’s certificate of incorporation. The Company prepared the unaudited pro forma basic and diluted net income (loss) per share attributable to common stock for the year ended December 31, 2015 and for the nine months ended September 30, 2016 assuming the automatic conversion of the redeemable convertible preferred stock as if the initial public offering had been completed on January 1, 2015.
Cash and Cash Equivalents—The Company considers all highly liquid investments with original maturities of three months or less at the date of purchase to be cash equivalents. Cash equivalents consist primarily of money market instruments.
Restricted Cash—Restricted cash consists of cash held in escrow on behalf of real estate buyers using our title and settlement services. Since the Company does not have rights to the cash, a corresponding customer deposit liability in the same amount is recognized in the consolidated balance sheets in other payables. When a real estate transaction closes, the restricted cash transfers from escrow and the corresponding deposit liability is reduced.
Short-Term Investments—The Company’s short-term investments consist of certificates of deposit with maturities of 12 months or less from the balance sheet date. Short-term investments are reported at cost, which approximates fair value, as of each balance sheet date.
Concentration of Credit Risk—Financial instruments that potentially subject the Company to concentrations of credit risk are primarily cash and cash equivalents. The Company generally places its cash and cash equivalents and short-term investments with high-credit-quality counterparties to make sure the financial institutions are stable when the Company’s deposits exceed Federal Deposit Insurance Corporation limits, and by policy, limit the amount of credit exposure to any one counterparty based on the Company’s analysis of the counterparty’s relative credit standing. The Company maintains its cash accounts with financial institutions where, at times, deposits exceed federal insurance limits.
Other Assets—Other assets consist primarily of leased building security deposits. In May 2016, the Company signed a new lease for its corporate headquarters with a security deposit of $5,424.
Fair Value of Financial Instruments—The Company’s financial instruments consist of cash and cash equivalents, short-term investments, accrued revenue, restricted cash, accounts payable, certain accrued liabilities, and redeemable convertible preferred stock. The fair value of the Company’s financial instruments approximates their recorded values due to their short period to maturity. Fair
F-8
Redfin Corporation and Subsidiaries
Notes to Consolidated Financial Statements—(Continued)
(information as of September 30, 2016 and for the nine months
ended September 30, 2015 and 2016 is unaudited)
value is defined as the exchange price that would be received for an asset or an exit price paid to transfer a liability in the principal or most advantageous market for the asset or liability in an orderly transaction between market participants on the measurement date. Valuation techniques used to measure fair value must maximize the use of observable inputs and minimize the use of unobservable inputs. The current accounting guidance for fair value measurements defines a three-level valuation hierarchy for disclosures as follows:
Level I—Unadjusted quoted prices in active markets for identical assets or liabilities.
Level II—Inputs other than quoted prices included within Level I that are observable, unadjusted quoted prices in markets that are not active, or other inputs that are observable or can be corroborated by observable market data.
Level III—Unobservable inputs that are supported by little or no market activity, requiring the Company to develop its own assumptions.
The categorization of a financial instrument within the valuation hierarchy is based upon the lowest level of input that is significant to the fair value measurement. The Company’s financial instruments consist of Level I and Level II assets and liabilities. Level I assets include highly liquid money market funds that are included in cash and cash equivalents and Level II assets include certificates of deposit that are included as short-term investments. The certificates of deposit are measured by observable market data for substantially the full term of the assets or liabilities. Level III includes redeemable convertible preferred stock that is adjusted to fair value at each reporting period using the underlying estimated fair value of the preferred securities. The fair value of each class of redeemable convertible preferred stock takes into account multiple inputs such as historical company performance, comparable companies, market conditions, exit scenarios and projections. The categorization of the framework used to price this temporary equity is considered a Level III, due to the subjective nature of the unobservable inputs used to determine the fair value.
F-9
Redfin Corporation and Subsidiaries
Notes to Consolidated Financial Statements—(Continued)
(information as of September 30, 2016 and for the nine months
ended September 30, 2015 and 2016 is unaudited)
The following table presents the Company’s financial assets and redeemable convertible preferred stock measured at fair value on a recurring basis as of December 31, 2014 and 2015, and September 30, 2016:
| As of December 31, 2014 | ||||||||||||||||||||
| Total Carrying Value | Level I | Level II | Level III | Total | ||||||||||||||||
| Financial assets: |
||||||||||||||||||||
| Money market funds (included in cash and cash equivalents) |
$ | 106,148 | $ | 106,148 | $ | — | $ | — | $ | 106,148 | ||||||||||
| Certificates of deposit (included in short-term investments) |
1,526 | — | 1,526 | — | 1,526 | |||||||||||||||
|
|
|
|
|
|
|
|
|
|
|
|||||||||||
| Total financial assets |
107,674 | 106,148 | 1,526 | — | 107,674 | |||||||||||||||
| Mezzanine equity: |
||||||||||||||||||||
| Redeemable convertible preferred stock |
497,699 | — | — | 497,699 | 497,699 | |||||||||||||||
|
|
|
|
|
|
|
|
|
|
|
|||||||||||
| Total mezzanine equity |
$ | 497,699 | $ | — | $ | — | $ | 497,699 | $ | 497,699 | ||||||||||
| As of December 31, 2015 | ||||||||||||||||||||
| Total Carrying Value | Level I | Level II | Level III | Total | ||||||||||||||||
| Financial assets: |
||||||||||||||||||||
| Money market funds (included in cash and cash equivalents) |
$ | 76,689 | $ | 76,689 | $ | — | $ | — | $ | 76,689 | ||||||||||
| Certificates of deposit (included in short-term investments) |
1,744 | — | 1,744 | — | 1,744 | |||||||||||||||
|
|
|
|
|
|
|
|
|
|
|
|||||||||||
| Total financial assets |
78,433 | 76,689 | 1,744 | — | 78,433 | |||||||||||||||
| Mezzanine equity: |
||||||||||||||||||||
| Redeemable convertible preferred stock |
599,914 | — | — | 599,914 | 599,914 | |||||||||||||||
|
|
|
|
|
|
|
|
|
|
|
|||||||||||
| Total mezzanine equity |
$ | 599,914 | $ | — | $ | — | $ | — | $ | — | ||||||||||
| As of September 30, 2016 | ||||||||||||||||||||
| Total Carrying Value | Level I | Level II | Level III | Total | ||||||||||||||||
| (unaudited) | ||||||||||||||||||||
| Financial assets: |
||||||||||||||||||||
| Money market funds (included in cash and cash equivalents) |
$ | 46,320 | $ | 46,320 | $ | — | $ | — | $ | 46,320 | ||||||||||
| Certificates of deposit (included in short-term investments) |
1,744 | — | 1,744 | — | 1,744 | |||||||||||||||
|
|
|
|
|
|
|
|
|
|
|
|||||||||||
| Total financial assets |
48,064 | 46,320 | 1,744 | — | 48,064 | |||||||||||||||
| Mezzanine equity: |
||||||||||||||||||||
| Redeemable convertible preferred stock |
543,095 | — | — | 543,095 | 543,095 | |||||||||||||||
|
|
|
|
|
|
|
|
|
|
|
|||||||||||
| Total mezzanine equity |
$ | 543,095 | $ | — | $ | — | $ | 543,095 | $ | 543,095 | ||||||||||
Leases—The Company categorizes leases at their inception as either operating or capital leases. On certain lease agreements, the Company may receive rent holidays and other incentives. The Company recognizes lease costs on a straight-line basis without regard to deferred payment terms, such as rent holidays, that defer the commencement date of required payments. Additionally, incentives the Company receives are treated as a reduction of rent expense over the term of the agreement and are presented in leasehold improvements and deferred rent on the balance sheet.
F-10
Redfin Corporation and Subsidiaries
Notes to Consolidated Financial Statements—(Continued)
(information as of September 30, 2016 and for the nine months
ended September 30, 2015 and 2016 is unaudited)
Technology and Development—Technology and development costs, which include research and development costs, are expensed as incurred and primarily include personnel costs (including base pay and benefits), stock-based compensation, data licenses, software and equipment, and infrastructure such as for data centers and hosted services. Technology and development expenses also include amortization of capitalized internal-use software and website and mobile application development costs.
Property and Equipment—Property and equipment are recorded at cost and depreciated over their estimated useful lives using the straight-line method over the estimated useful life of two to five years. Depreciation and amortization is included in direct real estate operations, technology and development, and general and administrative and is allocated based on estimated usage for each class of asset.
Leasehold improvements are amortized over the shorter of the lease term or the estimated useful life of the related asset. Upon retirement or sale, the cost of assets disposed of and the related accumulated depreciation are removed from the accounts, and any resulting gain or loss is reflected in the consolidated statements of operations. Repair and maintenance costs are expensed as incurred.
The costs incurred in the preliminary stages of website and software development are expensed as incurred. Once an application has reached the development stage, direct and incremental internal and external costs relating to upgrades or enhancements that meet the criteria for capitalization are capitalized in property and equipment and amortized on a straight-line basis over their estimated useful lives. Maintenance and enhancement costs (including those costs in the post-implementation stages) are typically expensed as incurred, unless such costs relate to substantial upgrades and enhancements to the websites (or software) that result in added functionality, in which case the costs are capitalized and amortized on a straight-line basis over the estimated useful lives.
Capitalized software development activities placed in service are amortized over the expected useful lives of those releases. The Company views capitalized software costs as either internal use or expansion. Currently, internal use and expansion useful lives are estimated at one year and three years, respectively. Amortization expense related to capitalized website and software development costs is included in depreciation and amortization expense under technology and development costs.
Estimated useful lives of website and software development activities are reviewed annually or whenever events or changes in circumstances indicate that intangible assets may be impaired and adjusted as appropriate to reflect upcoming development activities that may include significant upgrades or enhancements to the existing functionality. The Company capitalized software development costs of $2,548, $2,824, $2,202, and $2,103 during the years ended December 31, 2014 and 2015 and for the nine months ended September 30, 2015 and 2016, respectively.
Impairment of Long-Lived Assets—Long-lived assets are reviewed for impairment whenever events or changes in circumstances indicate that the carrying amount of such assets may not be recoverable. Recoverability of assets to be held and used is measured first by a comparison of the carrying amount of an asset to future undiscounted net cash flows expected to be generated by the asset. If such asset were considered to be impaired, an impairment loss would be recognized when the carrying amount of the asset exceeds the fair value of the asset. To date, no such impairment has occurred.
F-11
Redfin Corporation and Subsidiaries
Notes to Consolidated Financial Statements—(Continued)
(information as of September 30, 2016 and for the nine months
ended September 30, 2015 and 2016 is unaudited)
Intangible Assets—Intangible assets are finite lived and mainly consist of trade names, developed technology and customer relationships and are amortized over their estimated useful lives of ten years. The useful lives were determined by estimating future cash flows generated by the acquired intangible assets. Amortization expense is included in cost of revenue.
Goodwill—Goodwill represents the excess of the purchase price over the fair value of the net tangible assets and identifiable intangible assets acquired in a business combination. Goodwill is not amortized, but is subject to impairment testing. The Company assesses the impairment of goodwill on an annual basis, in its fourth quarter, or whenever events or changes in circumstances indicate that goodwill may be impaired. The Company assesses goodwill for possible impairment by first performing a qualitative assessment to determine whether it is more likely than not that the fair value of the reporting unit is less than its carrying amount. If the Company qualitatively determines that it is not more likely than not that the fair value of the reporting unit is less than its carrying amount, then the first and second steps of the goodwill impairment test are unnecessary. The first step of the goodwill impairment test identifies if there is potential goodwill impairment. If step one indicates that an impairment may exist, a second step is performed to measure the amount of the goodwill impairment, if any. Goodwill impairment exists when the estimated fair value of goodwill is less than its carrying value. If impairment exists, the carrying value of the goodwill is reduced to fair value through an impairment charge recorded in the Company’s statements of operations.
For the Company’s most recent impairment assessment performed as of October 1, 2015, the Company performed a qualitative assessment and determined that it was not more likely than not that the fair value of its reporting unit for which goodwill has been assigned was less than its carrying amount. In evaluating whether it was more likely than not that the fair value of its reporting unit was less than its carrying amount, the Company considered macroeconomic conditions, industry and market considerations, cost factors, its overall financial performance, other relevant entity-specific events, potential events affecting its reporting unit, and changes in the fair value of the Company’s common stock. The primary qualitative factors the Company considered in its analysis as of October 1, 2015 were the Company’s overall financial performance, including its revenue growth and the fair value of the reporting unit for which goodwill was assigned that was well in excess of its book value. The aggregate carrying value of goodwill was $9,186 at December 31, 2014 and 2015 and September 30, 2016. Goodwill, associated with the acquisition of Walk Score, Inc. (note 3), was assigned to the Company’s real estate services reporting unit as it benefits from the synergies of the acquisition. There have been no accumulated impairments to goodwill.
Revenue Recognition—Revenue primarily consists of commissions and fees charged on each real estate transaction completed by the Company or its partner agents. The Company’s key revenue components are brokerage revenue, partner revenue, and other revenue. The Company recognizes commission-based revenue upon closing of a real estate transaction, net of any commission refund or any closing-cost reduction. Fees and revenue from other services are recognized when the service is provided. Net commission revenue earned but not received is recorded as accrued revenue on the accompanying consolidated balance sheets, net of an allowance for doubtful accounts. Commission revenue is known and is clearing escrow, and therefore not estimated.
The Company establishes an allowance for doubtful accounts after reviewing historical experience, age of accounts receivable balances and any other known conditions that may affect collectability. The allowance for doubtful accounts balance was $0 as of December 31, 2014 and 2015
F-12
Redfin Corporation and Subsidiaries
Notes to Consolidated Financial Statements—(Continued)
(information as of September 30, 2016 and for the nine months
ended September 30, 2015 and 2016 is unaudited)
and $150 as of September 30, 2016. During the nine months ended September 30, 2016 there were $290 of changes and $140 of write-offs to the allowance.
Cost of Revenue—Costs of revenue consists of personnel costs (including base pay and benefits), stock-based compensation, transaction bonuses, tour and field expenses, listing expenses, business expenses, and facilities.
Advertising and Advertising Production Costs—The Company expenses advertising costs as they are incurred and production costs as of the first date the advertisement takes place. Advertising costs totaled $5,073 and $8,394 in 2014 and 2015, respectively, and $7,538 and $15,172 for the nine months ended September 30, 2015 and 2016, respectively, and are included in marketing expenses. Advertising production costs totaled $2,032 and $1,661 in 2014 and 2015, respectively, and $438 and $749 for the nine months ended September 30, 2015 and 2016, respectively, and are included in marketing expenses.
Income Taxes—Income taxes are accounted for using an asset and liability approach that requires the recognition of deferred tax assets and liabilities for the expected future tax consequences of temporary differences between the consolidated financial statement and tax bases of assets and liabilities at the applicable enacted tax rates. The Company will establish a valuation allowance for deferred tax assets if it is more likely than not that these items will expire before either the Company is able to realize their benefit or that future deductibility is uncertain.
The Company believes that it is currently more likely than not that our deferred tax assets will not be realized and as such, we have recorded a full valuation allowance for these assets. The Company evaluates the likelihood of the ability to realize deferred tax assets in future periods on a quarterly basis, and when appropriate evidence indicates we would release our valuation allowance accordingly. The determination to provide a valuation allowance is dependent upon the assessment of whether it is more likely than not that sufficient taxable income will be generated to utilize the deferred tax assets. Based on the weight of the available evidence, which includes the Company’s historical operating losses, lack of taxable income, and accumulated deficit, the Company provided a full valuation allowance against the U.S. tax assets resulting from the tax losses and credits carried forward
In addition, current tax laws impose substantial restrictions on the utilization of research and development credit and net operating loss (“NOL”) carryforwards in the event of an ownership change, as defined by the Internal Revenue Code Section 382 and 383. Such an event, having occurred in the past or in the future, may significantly limit the Company’s ability to utilize its net operating losses and research and development tax credit carryforwards.
Stock-based Compensation—The Company recognizes expense related to the fair value of stock-based compensation. Compensation cost recognized for the years ended December 31, 2014 and 2015 and the nine months ended September 30, 2015 and 2016 includes compensation cost for all stock-based compensation, based on the grant-date fair value, and recognized using the straight-line method over the requisite service period. The fair value of stock options granted was calculated using the Black-Scholes-Merton option-pricing model. The Company recognizes compensation for only the portion of options expected to vest. Therefore, management applied an estimated forfeiture rate that was derived from historical employee termination behavior. If the actual number of forfeitures differs from these estimates, additional adjustments to compensation expense may be required in
F-13
Redfin Corporation and Subsidiaries
Notes to Consolidated Financial Statements—(Continued)
(information as of September 30, 2016 and for the nine months
ended September 30, 2015 and 2016 is unaudited)
future periods. The Company has a stock-based compensation plan that is more fully described in note 6.
Recently Issued Accounting Pronouncements—In August 2016, the Financial Accounting Standards Board (“FASB”) issued guidance on the classification of certain cash receipts and cash payments in the statement of cash flows. This new standard will make eight targeted changes to how cash receipts and cash payments are presented and classified in the statement of cash flows. The new standard is effective for fiscal years beginning after December 15, 2018, which means that it will be effective for the Company in its fiscal year beginning January 1, 2019. The new standard will require adoption on a retrospective basis unless it is impracticable to apply, in which case the Company would be required to apply the amendments prospectively as of the earliest date practicable. The Company is currently evaluating the effect the adoption of this guidance will have on the Company’s cash flows.
In March 2016, the FASB issued guidance on several aspects of the accounting for stock-based payment transactions, including the income tax consequences, impact of forfeitures, classification of awards as either equity or liabilities and classification on the statement of cash flows. This guidance is effective for interim and annual reporting periods beginning after December 15, 2016, and early adoption is permitted. The Company has not yet determined its approach to adoption or the impact the adoption of this guidance will have on its financial position, results of operations or cash flows.
In February 2016, the FASB issued guidance on leases. This standard requires the recognition of a right-of-use asset and lease liability on the balance sheet for all leases. This standard also requires more detailed disclosures to enable users of financial statements to understand the amount, timing, and uncertainty of cash flows arising from leases. This guidance is effective for interim and annual reporting periods beginning after December 15, 2018 and should be applied through a modified retrospective transition approach for leases existing at, or entered into after, the beginning of the earliest comparative period presented in the financial statements, and early adoption is permitted. The Company expects to adopt this guidance on January 1, 2019. The Company believes adoption of this standard will have a significant impact on its financial position.
In November 2015, the FASB issued guidance on the balance sheet classification of deferred taxes. This standard requires that deferred tax liabilities and assets be classified as noncurrent in a classified statement of financial position. This guidance is effective for interim and annual reporting periods beginning after December 15, 2016, and early adoption is permitted. The Company has prospectively adopted this guidance as of January 1, 2016. The adoption of this guidance had no effect on the Company’s financial position.
In May 2014, the FASB issued guidance on revenue recognition. This guidance provides that an entity should recognize revenue to depict the transfer of promised goods or services to customers in an amount that reflects the consideration to which the entity expects to be entitled in exchange for those goods or services. This guidance also requires more detailed disclosures to enable users of financial statements to understand the nature, amount, timing, and uncertainty of revenue and cash flows arising from contracts with customers. The original effective date of this guidance was for interim and annual reporting periods beginning after December 15, 2016, early adoption is not permitted, and the guidance must be applied retrospectively or modified retrospectively. In July 2015, the FASB approved an optional one-year deferral of the effective date. As a result, the Company expects to adopt this guidance on January 1, 2018. In 2016, the FASB issued final amendments to clarify the
F-14
Redfin Corporation and Subsidiaries
Notes to Consolidated Financial Statements—(Continued)
(information as of September 30, 2016 and for the nine months
ended September 30, 2015 and 2016 is unaudited)
implementation guidance for principal versus agent considerations, identifying performance obligations and the accounting for licenses of intellectual property. The Company expects to adopt this guidance on January 1, 2018. The Company believes adoption of this standard will not have a significant impact on its financial position.
In August 2014, the FASB issued ASU No. 2014-15, Presentation of Financial Statements-Going Concern, related to the disclosures around going concern. The new standard provides guidance around management’s responsibility to evaluate whether there is substantial doubt about an entity’s ability to continue as a going concern and to provide related footnote disclosures. The new standard is effective for fiscal years ending after December 15, 2016, with early adoption permitted. The adoption of this standard is not expected to have a significant impact on the Company’s financial statements.
Note 2: Property and Equipment:
A summary of property and equipment at December 31, 2014 and 2015 and September 30, 2016, is as follows:
| Useful Lives | December 31, | September 30, 2016 |
||||||||||||
| 2014 | 2015 | |||||||||||||
| (years) | (in thousands) | (unaudited) | ||||||||||||
| Leasehold improvements |
Shorter of lease term or economic life |
$ | 3,005 | $ | 3,559 | $ | 3,978 | |||||||
| Website and software development costs |
1-3 | 4,116 | 6,939 | 9,023 | ||||||||||
| Computer and office equipment |
3 | 1,963 | 2,160 | 2,415 | ||||||||||
| Software |
3 | 836 | 1,394 | 1,395 | ||||||||||
| Furniture |
7 | 772 | 1,156 | 1,637 | ||||||||||
| Construction in progress |
— | — | 1,835 | |||||||||||
|
|
|
|
|
|
|
|||||||||
| 10,692 | 15,208 | 20,283 | ||||||||||||
| Accumulated depreciation and amortization |
(4,062 | ) | (7,830 | ) | (11,898 | ) | ||||||||
|
|
|
|
|
|
|
|||||||||
| Property and equipment, net |
$ | 6,630 | $ | 7,378 | $ | 8,385 | ||||||||
|
|
|
|
|
|
|
|||||||||
Depreciation and amortization expense for property and equipment amounted to $2,550 and $3,907 for the years ended December 31, 2014 and 2015, respectively, and $2,723 and $4,166 for the nine months ended September 30, 2015 and 2016.
Note 3: Business Combination and Acquired Intangible Assets:
On October 14, 2014, Redfin and Walk Score, Inc., a Washington corporation (“Walk Score”), entered into an agreement and plan of merger (the “Merger Agreement”), pursuant to which Redfin agreed to acquire Walk Score. The transaction closed on October 22, 2014. The acquisition was part of the Company’s strategy to better position itself in search engine optimization and increase traffic to the Company’s website. The net consideration transferred included $5,500 cash plus working capital and transaction expense adjustments of $282 and 4,000,000 shares of common stock valued at $8,520. There were no contingencies or earn outs included in the consideration. The Company has included the financial results of Walk Score in its consolidated financial statements from the date of acquisition, and the results of operations are not significant. Pro forma financial information for the
F-15
Redfin Corporation and Subsidiaries
Notes to Consolidated Financial Statements—(Continued)
(information as of September 30, 2016 and for the nine months
ended September 30, 2015 and 2016 is unaudited)
acquisition accounted for as a business combination has not been presented, as the effects were not material to our consolidated financial statements. The Company incurred acquisition and related costs of approximately $261, which were recorded as expense for the year ended December 31, 2014, and are included in general and administrative in the consolidated statements of operation. Acquisition-related costs include legal costs and professional services.
The allocation of the total consideration to the fair values of the assets acquired and liabilities assumed as of October 22, 2014, the acquisition date, is as follows:
| Gross cash contributed by Redfin |
$ | 5,782 | ||
| Fair value of common stock |
8,520 | |||
|
|
|
|||
| Gross consideration |
$ | 14,302 | ||
|
|
|
|||
| Cash acquired from Walk Score bank accounts |
(263 | ) | ||
| Walk Score cash-in-transit to satisfy employee payable |
(1,446 | ) | ||
|
|
|
|||
| Net consideration |
$ | 12,594 | ||
|
|
|
The allocation of the purchase price to Redfin’s assets acquired and liabilities assumed, net of cash acquired, is as follows:
| Assets acquired: |
||||
| Accounts receivable |
$ | 71 | ||
| Other current assets |
90 | |||
| Intangible assets |
4,880 | |||
| Goodwill |
9,186 | |||
|
|
|
|||
| Total assets acquired |
$ | 14,227 | ||
|
|
|
|||
| Liabilities assumed: |
||||
| Accrued and other current liabilities |
1,327 | |||
| Deferred tax liability |
306 | |||
|
|
|
|||
| Total liabilities assumed |
1,633 | |||
|
|
|
|||
| Net assets acquired |
$ | 12,594 | ||
|
|
|
The acquisition resulted in an income tax benefit due to a reduction of the valuation allowance from the acquired NOL carryforwards. Income tax benefit of $306 (note 8) and an increase to goodwill by the same amount were recorded.
F-16
Redfin Corporation and Subsidiaries
Notes to Consolidated Financial Statements—(Continued)
(information as of September 30, 2016 and for the nine months
ended September 30, 2015 and 2016 is unaudited)
As part of the business combination, the Company recorded $4,880 in intangible assets, measured at fair value, as reflected in the table below. Acquired intangible assets are amortized using the straight-line method over their estimated useful life, which approximates the expected use of these assets. Amortization expense amounted to $122 and $488 for the years ended December 31, 2014 and 2015, respectively, and $366 for the nine months ended September 30, 2015 and 2016.
| December 31, 2014 | December 31, 2015 | September 30, 2016 | ||||||||||||||||||||||||||||||||||||||
| (unaudited) | ||||||||||||||||||||||||||||||||||||||||
| Useful Lives (years) |
Gross | Accumulated Amortization |
Net | Gross | Accumulated Amortization |
Net | Gross | Accumulated Amortization |
Net | |||||||||||||||||||||||||||||||
| Trade names |
10 | $ | 1,040 | $ | (26 | ) | $ | 1,014 | $ | 1,040 | $ | (130 | ) | $ | 910 | $ | 1,040 | $ | (208 | ) | $ | 832 | ||||||||||||||||||
| Developed technology |
10 | 2,980 | (75 | ) | 2,905 | 2,980 | (372 | ) | 2,608 | 2,980 | (596 | ) | 2,384 | |||||||||||||||||||||||||||
| Customer relationships |
10 | 860 | (21 | ) | 839 | 860 | 107 | 753 | 860 | (172 | ) | 688 | ||||||||||||||||||||||||||||
|
|
|
|
|
|
|
|
|
|
|
|
|
|
|
|
|
|
|
|||||||||||||||||||||||
| $ | 4,880 | $ | (122 | ) | $ | 4,758 | $ | 4,880 | $ | (610 | ) | $ | 4,270 | $ | 4,880 | $ | (976 | ) | $ | 3,904 | ||||||||||||||||||||
|
|
|
|
|
|
|
|
|
|
|
|
|
|
|
|
|
|
|
|||||||||||||||||||||||
Note 4: Operating Segments:
Operating segments are defined as components of an enterprise for which separate financial information is available and evaluated regularly by the chief operating decision maker (“CODM”) in deciding how to make operating decisions, allocate resources and in assessing performance. The Company has four operating segments and one reportable segment, real estate. Real estate revenue is derived from commissions and fees charged on real estate transactions closed by us or partner agents. Other revenue consists of fees charged for title and settlement services, marketing services provided to homebuilders by the Company’s builder services group, Walk Score licensing and advertising fees, and other services. The Company’s CODM is its Chief Executive Officer. The CODM evaluates the performance of the Company’s operating segments based on revenue and gross profit. The Company does not analyze discrete segment balance sheet information related to long-term assets, all of which are located in the United States. All other financial information is presented on a consolidated basis.
F-17
Redfin Corporation and Subsidiaries
Notes to Consolidated Financial Statements—(Continued)
(information as of September 30, 2016 and for the nine months
ended September 30, 2015 and 2016 is unaudited)
Information on each of the reportable and other segments and reconciliation to consolidated net income (loss) is as follows:
| Year Ended December 31, | Nine Months Ended September 30, |
|||||||||||||||
| 2014 | 2015 | 2015 | 2016 | |||||||||||||
| (unaudited) | ||||||||||||||||
| Real estate |
||||||||||||||||
| Revenue |
$ | 121,804 | $ | 181,446 | $ | 137,090 | $ | 195,203 | ||||||||
| Cost of revenue |
89,620 | 131,522 | 98,080 | 132,990 | ||||||||||||
|
|
|
|
|
|
|
|
|
|||||||||
| Gross profit |
$ | 32,184 | $ | 49,924 | $ | 39,010 | $ | 62,213 | ||||||||
|
|
|
|
|
|
|
|
|
|||||||||
| Other |
||||||||||||||||
| Revenue |
3,559 | 5,892 | 4,515 | 5,211 | ||||||||||||
| Cost of revenue |
3,652 | 6,970 | 5,394 | 5,965 | ||||||||||||
|
|
|
|
|
|
|
|
|
|||||||||
| Gross profit |
$ | (93 | ) | $ | (1,078 | ) | $ | (879 | ) | $ | (754 | ) | ||||
|
|
|
|
|
|
|
|
|
|||||||||
| Consolidated |
||||||||||||||||
| Revenue |
125,363 | 187,338 | 141,605 | 200,414 | ||||||||||||
| Cost of revenue |
93,272 | 138,492 | 103,474 | 138,955 | ||||||||||||
|
|
|
|
|
|
|
|
|
|||||||||
| Gross profit |
$ | 32,091 | $ | 48,846 | $ | 38,131 | $ | 61,459 | ||||||||
|
|
|
|
|
|
|
|
|
|||||||||
| Operating expenses |
57,174 | 79,135 | 59,631 | 78,820 | ||||||||||||
| Net income (loss) |
$ | (24,730 | ) | $ | (30,236 | ) | $ | (21,465 | ) | $ | (17,191 | ) | ||||
Real estate revenue consisted of the following:
| Year Ended December 31, | Nine Months Ended September 30, |
|||||||||||||||
| 2014 | 2015 | 2015 | 2016 | |||||||||||||
| (unaudited) | ||||||||||||||||
| Real estate revenue |
||||||||||||||||
| Brokerage revenue |
$ | 115,701 | $ | 171,276 | $ | 129,595 | $ | 183,440 | ||||||||
| Partner revenue |
6,103 | 10,170 | 7,495 | 11,764 | ||||||||||||
|
|
|
|
|
|
|
|
|
|||||||||
| Total real estate revenue |
$ | 121,804 | $ | 181,446 | $ | 137,090 | $ | 195,203 | ||||||||
|
|
|
|
|
|
|
|
|
|||||||||
F-18
Redfin Corporation and Subsidiaries
Notes to Consolidated Financial Statements—(Continued)
(information as of September 30, 2016 and for the nine months
ended September 30, 2015 and 2016 is unaudited)
Note 5: Redeemable Convertible Preferred Stock and Stockholders’ Deficit:
Redeemable Convertible Preferred Stock—Redeemable convertible preferred stock is issuable in one or more series, each with such designations, rights, qualifications, limitations, and restrictions as the board of directors of the Company may determine at the time of issuance. As of December 31, 2014 and 2015 and September 30, 2016, the Company had outstanding redeemable convertible preferred stock as follows:
| As of December 31, 2014 and 2015 | ||||||||||||||||
| Shares Authorized |
Shares Issued and Outstanding |
Aggregate Liquidation Preference |
Proceeds, Net of Issuance Costs |
|||||||||||||
| Series A-1 |
4,378,284 | 4,378,284 | $ | 500 | $ | 462 | ||||||||||
| Series A-2 |
109,552 | 109,552 | 11 | 11 | ||||||||||||
| Series A-3 |
9,099,610 | 9,099,610 | 259 | 241 | ||||||||||||
| Series B |
36,338,577 | 36,338,577 | 7,998 | 7,952 | ||||||||||||
| Series C |
33,388,982 | 33,388,982 | 12,000 | 11,950 | ||||||||||||
| Series D |
28,574,005 | 28,574,005 | 10,269 | 10,201 | ||||||||||||
| Series E |
12,041,148 | 12,041,148 | 14,924 | 14,841 | ||||||||||||
| Series F |
20,808,580 | 20,808,580 | 50,536 | 50,453 | ||||||||||||
| Series G |
21,527,376 | 21,527,376 | 70,991 | 68,062 | ||||||||||||
|
|
|
|
|
|
|
|
|
|||||||||
| Total |
166,266,114 | 166,266,114 | $ | 167,488 | $ | 164,173 | ||||||||||
|
|
|
|
|
|
|
|
|
|||||||||
| As of September 30, 2016 | ||||||||||||||||
| (unaudited) | ||||||||||||||||
| Shares Authorized |
Shares Issued and Outstanding |
Aggregate Liquidation Preference |
Proceeds, Net of Issuance Costs |
|||||||||||||
| Series A-1 |
4,378,284 | 4,378,284 | $ | 500 | $ | 462 | ||||||||||
| Series A-2 |
109,552 | 109,552 | 11 | 11 | ||||||||||||
| Series A-3 |
9,099,610 | 9,099,610 | 259 | 241 | ||||||||||||
| Series B |
36,338,577 | 36,338,577 | 7,998 | 7,952 | ||||||||||||
| Series C |
33,388,982 | 33,388,982 | 12,000 | 11,950 | ||||||||||||
| Series D |
28,574,005 | 28,574,005 | 10,269 | 10,201 | ||||||||||||
| Series E |
12,041,148 | 12,041,148 | 14,924 | 14,841 | ||||||||||||
| Series F |
20,808,580 | 20,808,580 | 50,536 | 50,453 | ||||||||||||
| Series G |
21,527,376 | 21,527,376 | 70,991 | 68,062 | ||||||||||||
|
|
|
|
|
|
|
|
|
|||||||||
| Total |
166,266,114 | 166,266,114 | $ | 167,488 | $ | 164,173 | ||||||||||
|
|
|
|
|
|
|
|
|
|||||||||
The terms of all redeemable convertible preferred stock are summarized below:
Conversion—Each share of redeemable convertible preferred stock is convertible at the option of the holder into such number of common stock as is determined by dividing the original issue price by the conversion price in effect at the time of conversion. The original issue prices are as follows: $0.1142 for Series A-1 preferred, $0.0971 for Series A-2 preferred, $0.0285 for Series A-3 preferred, $0.2201 for Series B preferred, $0.3594 for Series C preferred, $0.3594 for Series D preferred, $1.2394 for Series E preferred, $2.4286 for Series F preferred, and $3.2977 for Series G preferred. Under the terms of the Company’s amended and restated certificate of incorporation, redeemable convertible preferred stock shall be automatically converted into shares of common stock upon the
F-19
Redfin Corporation and Subsidiaries
Notes to Consolidated Financial Statements—(Continued)
(information as of September 30, 2016 and for the nine months
ended September 30, 2015 and 2016 is unaudited)
occurrence of specific events, including a firm commitment underwritten public offering with aggregate net proceeds of not less than $50,000.
Liquidation Preference—In the event of a voluntary or involuntary liquidation, dissolution, or winding-up of the Company, the holders of redeemable convertible preferred stock will be entitled to receive, prior and in preference to any distribution of any of the assets of the Company to the holders of common stock, an amount per share equal to the greater of (1) the original issue price (as adjusted for stock splits, stock dividends, reclassifications, and the like) for each share of redeemable convertible preferred stock held by them, plus declared but unpaid dividends, and (2) the amount such holder would have received if, immediately prior to such event, such holder had converted such share of redeemable convertible preferred stock into common stock. After payment of all preferential amounts, the remaining assets shall be distributed ratably among all holders of common stock on a pro rata basis based on the number of shares of common stock outstanding held by each such holder.
Redemption—At any time after December 15, 2021, the holders of not less than 67% of outstanding redeemable convertible preferred stock may request the Company to redeem all the outstanding shares of redeemable convertible preferred stock by paying in cash a sum per share with respect to each share of redeemable convertible preferred stock equal to the greater of (1) the original issue price of each share of preferred stock plus all declared but unpaid dividends or (2) the fair market value of each share of redeemable convertible preferred stock as determined by an appraisal performed by an independent third party approved by holders of at least 67% of the then outstanding shares of redeemable convertible preferred stock and the Company.
Accretion represents the increase or decrease in the redemption value of the Company’s redeemable convertible preferred stock. For the nine months ended September 30, 2016, the redemption value decreased from the last reporting period, December 31, 2015, while the redemption value increased for all other periods presented.
The following table presents the accretion of the redeemable convertible preferred stock to its redemption value recorded within the consolidated statements of changes in redeemable convertible preferred stock and stockholders’ deficit during the periods presented:
| Year Ended December 31, |
Nine Months Ended September 30, |
|||||||||||||||
| 2014 | 2015 | 2015 | 2016 | |||||||||||||
| (unaudited) | ||||||||||||||||
| Series A-1 |
$ | (3,065 | ) | $ | (2,674 | ) | $ | (1,277 | ) | $ | 1,448 | |||||
| Series A-2 |
(77 | ) | (67 | ) | (32 | ) | 36 | |||||||||
| Series A-3 |
(6,279 | ) | (5,650 | ) | (2,845 | ) | 3,010 | |||||||||
| Series B |
(25,437 | ) | (22,561 | ) | (11,359 | ) | 12,021 | |||||||||
| Series C |
(23,372 | ) | (20,390 | ) | (9,742 | ) | 11,039 | |||||||||
| Series D |
(20,002 | ) | (17,450 | ) | (8,337 | ) | 9,447 | |||||||||
| Series E |
(9,151 | ) | (7,353 | ) | (3,764 | ) | 4,102 | |||||||||
| Series F |
(10,404 | ) | (12,494 | ) | (6,071 | ) | 7,084 | |||||||||
| Series G |
(3,464 | ) | (13,585 | ) | (5,384 | ) | 8,632 | |||||||||
|
|
|
|
|
|
|
|
|
|||||||||
| Total |
$ | (101,251 | ) | $ | (102,224 | ) | $ | (48,811 | ) | $ | 56,819 | |||||
|
|
|
|
|
|
|
|
|
|||||||||
F-20
Redfin Corporation and Subsidiaries
Notes to Consolidated Financial Statements—(Continued)
(information as of September 30, 2016 and for the nine months
ended September 30, 2015 and 2016 is unaudited)
Voting—The holder of each share of redeemable convertible preferred stock has the right to one vote for each full share of common stock into which its respective shares of redeemable convertible preferred stock would be convertible on the record date for the vote.
Dividends—The holders of redeemable convertible preferred stock are entitled to receive noncumulative dividends out of any funds legally available, prior and in preference to any declaration or payment of any dividends to holders of common stock. Dividends are payable when, as and if declared by the Board of Directors at a rate of $0.0091 per share for Series A-1 preferred, $0.0078 per share for Series A-2 preferred, $0.0023 per share for Series A-3 preferred, $0.0176 per share for Series B preferred, $0.0288 per share for Series C preferred and Series D preferred, $0.0992 per share for Series E preferred, $0.1943 per share for Series F preferred, and $0.2638 per share Series G preferred, per year (as adjusted for stock splits, stock dividends, reclassifications and the like). The holders of the redeemable convertible preferred stock also shall be entitled to participate pro rata in any dividends or other distributions paid on the common stock on an as-if-converted basis.
Common Stock—At December 31, 2014 and 2015 and September 30, 2016, the Company was authorized to issue 255,000,000, 255,000,000, and 290,081,638 shares of common stock with a par value of $0.001 per share, respectively.
The Company has reserved shares of common stock, on an as-converted basis, for future issuance as follows:
| December 31, | September 30, | |||||||||||
| 2014 | 2015 | 2016 | ||||||||||
| (unaudited) | ||||||||||||
| Redeemable convertible preferred stock outstanding |
166,266,114 | 166,266,114 | 166,266,114 | |||||||||
| Stock options issued and outstanding |
27,672,196 | 31,235,451 | 38,040,107 | |||||||||
| Shares available for future equity grants |
9,707,283 | 1,904,590 | 17,185,755 | |||||||||
|
|
|
|
|
|
|
|||||||
| Total |
203,645,593 | 199,406,155 | 221,491,976 | |||||||||
|
|
|
|
|
|
|
|||||||
Treasury Stock Receivable—In 2013, the Company exercised a repurchase right to reacquire shares outstanding pursuant to separation agreements with two founders. The Company, as of December 31, 2013, recorded a treasury share receivable for $1,170 and recorded a corresponding payable. This transaction resulted in a reduction of 2,924,500 shares of common stock outstanding as of December 31, 2013. In 2014, the Company reached a settlement agreement with the two founders to repurchase only 1,924,500 shares of common stock, which were subsequently retired.
Note 6: Stock-based Compensation:
On November 5, 2004, the Company adopted the 2004 Equity Incentive Plan (as amended to date, the “Plan”), which provides for the issuance of incentive and nonqualified common stock options to employees, directors, officers, and consultants of the Company. Subsequent to adoption, the Company amended the Plan to increase the number of shares of common stock reserved for issuance to 89,651,602. The term of each option shall be no more than 10 years. The options generally vest over a four-year period.
F-21
Redfin Corporation and Subsidiaries
Notes to Consolidated Financial Statements—(Continued)
(information as of September 30, 2016 and for the nine months
ended September 30, 2015 and 2016 is unaudited)
The grant-date fair value of each option award is estimated on the date of grant using the Black-Scholes-Merton option-pricing model. The inputs used below are subjective and generally require significant analysis and judgment to develop. The Company has not declared or paid any cash dividends and does not currently expect to do so in the future. The risk-free interest rate used in the Black-Scholes-Merton option-pricing model is based on the implied yield currently available in U.S. Treasury securities at maturity with an equivalent term. Expected volatility is based on an average volatility of stock prices for a group of real estate and technology industry peers. In 2015, the Company changed the group of comparable companies used to calculate volatility due to external mergers and acquisitions in the real estate industry. The Company uses the “simplified method” to calculate expected life due to the lack of historical exercise data, which assumes a ratable rate of exercise over the contractual life to estimate the expected term for employee options. The expected term of options represents the period that the stock-based awards are expected to be outstanding for the remaining unexercised shares. The range of assumptions for the years ended December 31, 2014 and 2015 and the nine months ended September 30, 2015 and 2016 are provided in the following table:
| Year Ended December 31, | Nine Months Ended September 30, | |||||||
| 2014 | 2015 | 2015 | 2016 | |||||
| (unaudited) | ||||||||
| Expected life |
7 years | 7 years | 7 years | 7 years | ||||
| Volatility |
51.43%-54.56% | 42.51%-49.62% | 49.62% | 38.88%-41.36% | ||||
| Risk-free interest rate |
1.88%-2.30% | 1.71%-2.01% | 1.71% | 1.39%-1.66% | ||||
| Dividend yield |
0% | 0% | 0% | 0% | ||||
| Weighted-average grant date fair value |
1.17 | 1.33 | 1.33 | 1.25 | ||||
F-22
Redfin Corporation and Subsidiaries
Notes to Consolidated Financial Statements—(Continued)
(information as of September 30, 2016 and for the nine months
ended September 30, 2015 and 2016 is unaudited)
The following table presents information regarding options granted, exercised, forfeited, or cancelled for the periods presented:
| Number Of Options |
Weighted- Average Exercise Price |
Weighted- Average Remaining Contractual Life (years) |
Aggregate Intrinsic Value |
|||||||||||||
| Outstanding at January 1, 2014 |
27,245,596 | $ | 0.49 | 8.09 | ||||||||||||
| Options granted |
6,690,002 | 2.11 | ||||||||||||||
| Options exercised |
(5,301,436 | ) | 0.29 | $ | 9,763 | |||||||||||
| Options forfeited or canceled |
(961,966 | ) | 0.84 | |||||||||||||
|
|
|
|||||||||||||||
| Outstanding at December 31, 2014 |
27,672,196 | 0.93 | 8.05 | 33,277 | ||||||||||||
|
|
|
|||||||||||||||
| Options granted |
10,569,087 | 2.77 | ||||||||||||||
| Options exercised |
(4,290,504 | ) | 0.43 | 10,469 | ||||||||||||
| Options forfeited or canceled |
(2,715,328 | ) | 1.65 | |||||||||||||
|
|
|
|||||||||||||||
| Outstanding at December 31, 2015 |
31,235,451 | 1.54 | 7.98 | 41,543 | ||||||||||||
|
|
|
|||||||||||||||
| Options granted (unaudited) |
9,090,259 | 2.89 | ||||||||||||||
| Options exercised (unaudited) |
(1,355,172 | ) | 0.76 | 2,631 | ||||||||||||
| Options forfeited or canceled (unaudited) |
(930,431 | ) | 2.27 | |||||||||||||
|
|
|
|||||||||||||||
| Outstanding at September 30, 2016 (unaudited) |
38,040,107 | 1.87 | 7.83 | 31,411 | ||||||||||||
|
|
|
|||||||||||||||
| Options exercisable at December 31, 2015 |
14,363,335 | 1.54 | 7.98 | 19,103 | ||||||||||||
|
|
|
|||||||||||||||
| Options vested and expected to vest at December 31, 2015 |
29,856,999 | 1.51 | 7.93 | 40,606 | ||||||||||||
|
|
|
|||||||||||||||
| Options exercisable at September 30, 2016 (unaudited) |
18,514,040 | 1.87 | 7.83 | 15,287 | ||||||||||||
|
|
|
|||||||||||||||
| Options vested and expected to vest at September 30, 2016 (unaudited) |
36,821,680 | 1.94 | 8.09 | 28,121 | ||||||||||||
|
|
|
|||||||||||||||
The total fair value of shares vested during 2014 and 2015 and the nine months ended September 30, 2015 and 2016 was $3,630, $4,917, $3,357, and $6,215, respectively. The total fair value of shares exercised during 2014 and 2015 and the nine months ended September 30, 2015 and 2016 was $1,295, $1,373, $1,186, and $620, respectively.
The following table presents the detail of stock-based compensation amounts included in the Company’s consolidated statements of operations for the periods indicated below:
| Year Ended December 31, | Nine Months Ended September 30, |
|||||||||||||||
| 2014 | 2015 | 2015 | 2016 | |||||||||||||
| (unaudited) | ||||||||||||||||
| Cost of revenue |
$ | 1,280 | $ | 1,440 | $ | 985 | $ | 1,589 | ||||||||
| Technology and development |
962 | 1,375 | 971 | 1,653 | ||||||||||||
| Marketing |
237 | 298 | 208 | 336 | ||||||||||||
| General and administrative |
2,717 | 2,449 | 1,881 | 2,312 | ||||||||||||
|
|
|
|
|
|
|
|
|
|||||||||
| Total stock-based compensation |
$ | 5,196 | $ | 5,562 | $ | 4,045 | $ | 5,890 | ||||||||
|
|
|
|
|
|
|
|
|
|||||||||
Stock-based compensation of $373 is included in general and administrative expenses attributable to the tender offer that occurred in January 2014. Existing investors acquired 1,540,023
F-23
Redfin Corporation and Subsidiaries
Notes to Consolidated Financial Statements—(Continued)
(information as of September 30, 2016 and for the nine months
ended September 30, 2015 and 2016 is unaudited)
shares of common stock at a premium of $0.39 per share over the fair value at the time of the tender offer. Of the 1,540,023 shares, 959,940 were purchased from employees and 580,083 were purchased from non-employees. The premium attributable to the shares tendered from non-employees for $225 were treated as an in-substance dividend.
Stock-based compensation of $970 is included in general and administrative expenses attributable to the stock modification settlement with two founders. The settlement agreement provided a total of 1,000,000 shares of common stock will remain outstanding and will not be subject to a right of repurchase. The settlement occurred in 2014 (note 5).
Stock-based compensation of $772 is included in general and administrative expenses attributable to the tender offer that closed in August 2015. An existing investor acquired 4,780,236 shares of common stock at a premium of $0.72 per share over the fair value at the time of the tender offer. Of the 4,780,236 shares, 1,074,992 were purchased from employees and 3,705,244 were purchased from nonemployees. The premium attributable to the shares tendered from nonemployees in the amount of $2,659 were treated as an in-substance dividend.
The Company capitalizes stock-based compensation related to work performed on internally developed software. There was $0, $49, and $39, $57 of stock-based compensation that was capitalized in the years ended 2014 and 2015 and the nine months ended September 30, 2015 and 2016, respectively. All stock-based compensation is related to employees in technology and development.
There was $17,889 and $21,860 of total unrecognized stock-based compensation related to nonvested stock option arrangements granted under the Plan as of December 31, 2015 and September 30, 2016, respectively. These costs are expected to be recognized over a weighted-average period of 2.89 years and 2.75 years, respectively. The total fair value of options vested was $41,223 and $52,210 as of December 31, 2015 and September 30, 2016, respectively.
Note 7: Net Income (Loss) per Share Attributable to Common Stock:
Net income (loss) per share attributable to common stock is computed by dividing the net income (loss) attributable to common stock by the weighted-average number of common shares outstanding. The Company has outstanding stock options and redeemable convertible preferred stock, which are included in the calculation of diluted net income attributable to common stock per share whenever to do so would be dilutive.
The Company calculates basic and diluted net income (loss) per share attributable to common stock in conformity with the two-class method required for companies with participating securities. The Company considers all series of redeemable convertible preferred stock to be participating securities. Under the two-class method, the net income (loss) attributable to common stock is not allocated to the redeemable convertible preferred stock as the holders of redeemable convertible preferred stock do not have a contractual obligation to share in losses.
The diluted net income (loss) per share attributable to common stock is computed by giving effect to all potential dilutive common stock equivalents outstanding for the period. For purposes of this calculation, redeemable convertible preferred stock and options to purchase common stock are
F-24
Redfin Corporation and Subsidiaries
Notes to Consolidated Financial Statements—(Continued)
(information as of September 30, 2016 and for the nine months
ended September 30, 2015 and 2016 is unaudited)
considered anti-dilutive securities for all periods presented except for the nine months ended September 30, 2016 and have been excluded from the calculation of diluted net income (loss) per share attributable to common stock. Basic and diluted net income (loss) per share attributable to common stock was the same for each period presented, except for the nine months ended September 30, 2016, as the inclusion of the Company’s redeemable convertible preferred stock was dilutive. Options were excluded in the calculation of weighted average shares used to compute diluted net income (loss) per share attributable to common stock for the nine months ended September 30, 2016, as their effect was anti-dilutive.
The following table sets forth the calculation of basic and diluted net income (loss) per share attributable to common stock during the periods presented:
| Year Ended December 31, | Nine Months Ended September 30, |
|||||||||||||||
| 2014 | 2015 | 2015 | 2016 | |||||||||||||
| (unaudited) | ||||||||||||||||
| Numerator: |
||||||||||||||||
| Net income (loss) |
$ | (24,730 | ) | $ | (30,236 | ) | $ | (21,465 | ) | $ | (17,191 | ) | ||||
| Accretion of preferred stock |
(101,251 | ) | (102,224 | ) | (48,811 | ) | 56,819 | |||||||||
| Undistributed earnings attributable to participating securities |
— | — | — | (31,483 | ) | |||||||||||
|
|
|
|
|
|
|
|
|
|||||||||
| Net income (loss) attributable to common stock—basic |
(125,981 | ) | (132,460 | ) | (70,276 | ) | 8,145 | |||||||||
|
|
|
|
|
|
|
|
|
|||||||||
| Net income (loss) attributable to common stock—diluted |
(125,981 | ) | (132,460 | ) | (70,276 | ) | (17,191 | )(1) | ||||||||
|
|
|
|
|
|
|
|
|
|||||||||
| Denominator: |
||||||||||||||||
| Weighted average shares used to compute net income (loss) per share attributable to common stock—basic |
32,150,025 | 40,249,762 | 39,669,071 | 43,017,478 | ||||||||||||
| Weighted average shares used to compute net income (loss) per share attributable to common stock—diluted |
32,150,025 | 40,249,762 | 39,669,071 | 209,288,537 | ||||||||||||
| Net income (loss) per share attributable to common stock—basic |
$ | (3.92 | ) | $ | (3.29 | ) | $ | (1.77 | ) | $ | 0.19 | |||||
|
|
|
|
|
|
|
|
|
|||||||||
| Net income (loss) per share attributable to common stock—diluted |
$ | (3.92 | ) | $ | (3.29 | ) | $ | (1.77 | ) | $ | (0.08 | ) | ||||
|
|
|
|
|
|
|
|
|
|||||||||
|
(1) A reconciliation of net income (loss) attributable to common stock—basic to net income (loss) attributable to common stock—diluted is as follows: |
| |||||||||||||||
| Net income (loss) attributable to common |
$ | 8,145 | ||||||||||||||
| Add-back: Accretion due to application of if-converted |
(56,819 | ) | ||||||||||||||
| Add-back: Undistributed earnings attributable to participating securities due to application of if-converted |
31,483 | |||||||||||||||
|
|
|
|||||||||||||||
| Net income (loss) attributable to common stock—diluted |
$ | (17,191 | ) | |||||||||||||
|
|
|
|||||||||||||||
F-25
Redfin Corporation and Subsidiaries
Notes to Consolidated Financial Statements—(Continued)
(information as of September 30, 2016 and for the nine months
ended September 30, 2015 and 2016 is unaudited)
The following outstanding shares of common stock equivalents were excluded from the computation of the diluted net income (loss) per share attributable to common stock for the periods presented because their effect would have been anti-dilutive:
| Year Ended December 31, | Nine Months Ended September 30, |
|||||||||||||||
| 2014 | 2015 | 2015 | 2016 | |||||||||||||
| (unaudited) | ||||||||||||||||
| Redeemable convertible preferred stock |
166,266,114 | 166,266,114 | 166,266,114 | — | ||||||||||||
| Options outstanding |
27,672,196 | 31,235,451 | 24,038,590 | 38,040,107 | ||||||||||||
|
|
|
|
|
|
|
|
|
|||||||||
| Total |
193,938,310 | 197,501,565 | 190,304,704 | 38,040,107 | ||||||||||||
|
|
|
|
|
|
|
|
|
|||||||||
Note 8: Income Taxes:
The Company’s deferred income taxes reflect the net tax effects of temporary differences between the carrying amounts of assets and liabilities for financial reporting purposes and the amounts used for income tax purposes. The following table represents the significant components of the Company’s deferred tax assets and liabilities for the periods presented:
| December 31, | ||||||||
| 2014 | 2015 | |||||||
| Deferred tax assets: |
||||||||
| Net operating loss carryforwards |
$ | 19,594 | $ | 29,576 | ||||
| Credit carryforwards |
1,833 | 2,735 | ||||||
| Accruals and reserves |
1,612 | 3,094 | ||||||
|
|
|
|
|
|||||
| Gross deferred tax assets |
23,039 | 35,405 | ||||||
|
|
|
|
|
|||||
| Valuation allowance |
(20,211 | ) | (31,507 | ) | ||||
|
|
|
|
|
|||||
| Total deferred tax assets, net of valuation allowance |
2,828 | 3,898 | ||||||
| Deferred tax liabilities: |
||||||||
| Intangible assets |
(1,810 | ) | (1,625 | ) | ||||
| Prepaid expenses |
(1,018 | ) | (2,273 | ) | ||||
|
|
|
|
|
|||||
| Total deferred tax liabilities |
(2,828 | ) | (3,898 | ) | ||||
|
|
|
|
|
|||||
| Net deferred tax assets and liabilities |
$ | — | $ | — | ||||
|
|
|
|
|
|||||
The valuation allowance increased by $7,868 and $11,296 during the years ended December 31, 2014 and 2015, respectively.
The following table represents the Company’s net operating loss carryforwards as of December 31, 2014 and 2015:
| December 31, | ||||||||
| 2014 | 2015 | |||||||
| Federal |
$ | 52,726 | $ | 79,373 | ||||
| Various states |
$ | 2,456 | $ | 3,993 | ||||
NOL carryforwards are available to offset federal and state taxable income and begin to expire in 2025.
F-26
Redfin Corporation and Subsidiaries
Notes to Consolidated Financial Statements—(Continued)
(information as of September 30, 2016 and for the nine months
ended September 30, 2015 and 2016 is unaudited)
Current tax laws impose substantial restrictions on the utilization of research and development credit and NOL carryforwards in the event of an ownership change, as defined by the Internal Revenue Code Section 382 and 383. Such an event may significantly limit the Company’s ability to utilize its net NOLs and research and development tax credit carryforwards.
The components of loss before provision (benefit) for income taxes for the years ended December 31, 2014 and 2015 were $(25,036) and $(30,236) and the component of the provision (benefit) for income taxes were $(306) (note 3) in the year ended December 31, 2014, which related to a deferred tax liability from the Walk Score business combination.
In 2014, the Company acquired Walk Score in a nontaxable stock transaction and recorded $4,800 of identified intangibles and $4,700 of federal NOL carryforwards. The purchase accounting for the identified intangibles created a deferred tax liability, which represents a source of future income. The Company inherited Walk Score’s federal NOLs, which created a deferred tax asset to absorb the future income from the intangible deferred tax liability. Walk Score did not have any state NOLs to absorb future income from the intangible deferred tax liability, resulting in part of the valuation allowance on the Company’s state NOLs being released, resulting in a tax benefit of $306 and corresponding adjustment to goodwill.
The reconciliation of the U.S. federal income tax at statutory rate with the Company’s effective income tax rate:
| December 31, | ||||||||
| 2014 | 2015 | |||||||
| U.S. federal income tax at statutory rate |
34.00 | % | 34.00 | % | ||||
|
|
|
|
|
|||||
| State taxes (net of federal benefit) |
3.56 | 3.86 | ||||||
| Permanent differences |
(6.23 | ) | (2.94 | ) | ||||
| Federal research and development credit |
1.87 | 2.42 | ||||||
| Change in valuation allowance |
(32.45 | ) | (37.36 | ) | ||||
| Nondeductible expenses and others |
0.47 | 0.02 | ||||||
|
|
|
|
|
|||||
| Effective income tax rate |
1.22 | % | — | % | ||||
|
|
|
|
|
|||||
The Company recorded a tax benefit of $306 (note 3) and $0 for the 12 months ended December 31, 2014 and December 31, 2015, respectively, representing effective tax rates of 1.22% and 0.00% for the 12 months ended December 31, 2014 and December 31, 2015, respectively. The difference between the U.S. federal income tax at statutory rate of 34% and the Company’s effective tax rate in all periods is primarily due to a full valuation allowance related to the Company’s U.S. deferred tax assets.
The Company accounts for uncertainty in income taxes in accordance with ASC 740. Tax positions are evaluated in a two-step process, whereby the Company first determines whether it is more likely than not that a tax position will be sustained upon examination by the tax authority, including resolutions of any related appeals or litigation processes, based on technical merit. If a tax position meets the more-likely-than-not recognition threshold it is then measured to determine the amount of benefit to recognize in the financial statements. The tax position is measured as the largest amount of benefit that is greater than 50% likely of being realized upon ultimate settlement.
F-27
Redfin Corporation and Subsidiaries
Notes to Consolidated Financial Statements—(Continued)
(information as of September 30, 2016 and for the nine months
ended September 30, 2015 and 2016 is unaudited)
The following table summarized the activity related to unrecognized tax benefits:
| December 31, | ||||||||
| 2014 | 2015 | |||||||
| Unrecognized benefit—beginning of year |
$ | — | $ | 458 | ||||
| Gross increases (decreases)—prior year tax positions |
337 | — | ||||||
| Gross increases (decreases)—current year tax positions |
121 | 226 | ||||||
|
|
|
|
|
|||||
| Unrecognized benefit—end of year |
$ | 458 | $ | 684 | ||||
|
|
|
|
|
|||||
All of the unrecognized tax benefits as of December 31, 2014 and 2015 are accounted for as a reduction in the Company’s deferred tax assets. Due to the Company’s valuation allowance, none of the $458 and $684 of unrecognized tax benefits would affect the Company’s effective tax rate, if recognized. The Company does not believe it is reasonably possible that its unrecognized tax benefits will significantly change in the next twelve months.
The Company recognizes interest and penalties related to unrecognized tax benefits as income tax expense. There was no interest or penalties accrued related to unrecognized tax benefits for 2015 and 2014 and no liability for accrued interest or penalties related to unrecognized tax benefits as of December 31, 2015.
The Company’s material income tax jurisdiction is the United States (federal). As a result of NOL carryforwards, the Company is subject to audit for tax years 2005 and forward for federal purposes. There are tax years which remain subject to examination in various other jurisdictions that are not material to the Company’s financial statements.
Note 9: Commitments and Contingencies:
Legal Proceedings—In 2013, third-party licensed sales associates filed three lawsuits against the Company in the Superior Court of the State of California. Two of the actions, which are pled as “class actions,” were removed to and are now pending in the Northern District of California, assert claims on behalf of a putative class, and one of these cases also includes representative claims under California’s Private Attorney General Act, Labor Code section 2698 et. seq (“PAGA”). The third action is pending in the Los Angeles County Superior Court and asserts representative claims under PAGA. All three complaints alleged that the Company had misclassified current and former third-party licensed sales associates in California as independent contractors.
The claims vary from case to case, but generally seek compensation for unpaid wages, overtime, and failure to provide meal and rest periods, as well as reimbursement of business expenses. Each of these cases has been ordered to arbitration. The timeline for each arbitration proceeding is uncertain. Arbitration is currently set for December 2017 in one of the proceedings and no arbitration date has been set in the other two proceedings.
As with all class action and representative litigation, these cases are inherently complex and subject to many uncertainties. There can be no assurance, however, that if the actions continue and a class is certified, the plaintiffs will not seek substantial damage awards, penalties, attorneys’ fees, or other remedies. Given the preliminary stage of these cases, the claims and issues presented and the
F-28
Redfin Corporation and Subsidiaries
Notes to Consolidated Financial Statements—(Continued)
(information as of September 30, 2016 and for the nine months
ended September 30, 2015 and 2016 is unaudited)
great uncertainties regarding which third-party licensed sales associates, if any, may be part of a class if one is certified, we cannot estimate a range of reasonably possible losses. The Company believes it has complied with all applicable laws and regulations and that it properly classified the third-party licensed sales associates as independent contractors, and is vigorously defending these cases.
In addition, from time to time, the Company is involved in litigation, claims and other proceedings arising in the ordinary course of business. Such litigation and other proceedings may include, but are not limited to, actions relating to employment law, intellectual property, the Real Estate Settlement Procedures Act of 1974, the Fair Housing Act of 1968, or other consumer protection statute claims, commercial or contractual arrangements, brokerage- or real estate related-disputes, ordinary-course brokerage disputes like the failure to disclose property defects, and vicarious liability based upon conduct of individuals or entities outside of the Company’s control, including partner agents and third-party contractor agents. Litigation and other disputes are inherently unpredictable and subject to substantial uncertainties and unfavorable resolutions could occur. Often these cases raise complex factual and legal issues, which are subject to risks and uncertainties and could require significant management time and resources.
Facility Leases and Other Commitments—The Company leases its office space under noncancelable operating leases with terms ranging from one to eleven years. The leases require a fixed minimum rent with contractual minimum rent increases over the lease term, and certain leases include escalation provisions. Rent expense totaled $2,860 and $4,147 for the years ended December 31, 2014 and 2015, respectively, and $3,095 and $3,449 for the nine months ended September 30, 2015 and 2016, respectively. Other commitments primarily relate to network infrastructure for the Company’s data operations and commitments for the Company’s annual corporate meeting. Future minimum payments due under these agreements as of December 31, 2015 and September 30, 2016, are as follows:
| Facility Leases | Other Commitments | |||||||||||||||
| December 31, 2015 |
September 30, 2016 |
December 31, 2015 |
September 30, 2016 |
|||||||||||||
| (unaudited) | (unaudited) | |||||||||||||||
| 2016 |
$ | 4,245 | $ | 1,264 | $ | 1,651 | $ | 401 | ||||||||
| 2017 |
3,816 | 5,638 | 604 | 2,137 | ||||||||||||
| 2018 |
1,762 | 5,640 | 138 | 859 | ||||||||||||
| 2019 |
1,209 | 6,099 | — | — | ||||||||||||
| 2020 and thereafter |
53 | 36,411 | — | — | ||||||||||||
|
|
|
|
|
|
|
|
|
|||||||||
| Total minimum lease payments |
$ | 11,085 | $ | 55,052 | $ | 2,393 | $ | 3,397 | ||||||||
|
|
|
|
|
|
|
|
|
|||||||||
In May 2016, the Company entered into a lease for a new corporate headquarters in Seattle, Washington. The minimum lease payments total $43,768 and will be due over 133 months, beginning mid-2017 and lasting through 2027.
F-29
Redfin Corporation and Subsidiaries
Notes to Consolidated Financial Statements—(Continued)
(information as of September 30, 2016 and for the nine months
ended September 30, 2015 and 2016 is unaudited)
Note 10: Accrued Liabilities:
The following table presents the detail of accrued liabilities as of the dates presented:
| December 31, | September 30, 2016 |
|||||||||||
| 2014 | 2015 | |||||||||||
| (unaudited) | ||||||||||||
| Accrued compensation and benefits |
$ | 7,126 | $ | 13,707 | $ | 18,234 | ||||||
| Miscellaneous accrued liabilities |
3,875 | 1,185 | 3,744 | |||||||||
|
|
|
|
|
|
|
|||||||
| Total accrued liabilities: |
$ | 11,001 | $ | 14,892 | $ | 21,978 | ||||||
|
|
|
|
|
|
|
|||||||
Note 11: Retirement Plan:
The Company adopted a 401(k) profit sharing plan effective January 2005. The plan covers eligible employees as of their hire date. The 401(k) component of the plan allows employees to elect to defer from 1% to 100% of their eligible compensation up to the federal limit per year. Company-matching and profit-sharing contributions are discretionary and are determined annually by Company management and approved by the Board of Directors. No matching or profit-sharing contributions were declared for the years ended December 31, 2014 and 2015 or the nine months ended September 30, 2016.
Note 12: Subsequent Events:
The Company has evaluated subsequent events and transactions through February 3, 2017, the date the audited consolidated financial statements were issued.
Note 13: Subsequent Events (unaudited):
The Company has evaluated subsequent events and transactions through February 3, 2017, the date the unaudited consolidated financial statements were issued.
F-30
Shares
Common Stock
Goldman, Sachs & Co.
Through and including , 2017 (the 25th day after the date of this prospectus), all dealers effecting transactions in these securities, whether or not participating in this offering, may be required to deliver a prospectus. This is in addition to a dealer’s obligation to deliver a prospectus when acting as an underwriter and with respect to an unsold allotment or subscription.
PART II
INFORMATION NOT REQUIRED IN PROSPECTUS
| ITEM 13. | OTHER EXPENSES OF ISSUANCE AND DISTRIBUTION. |
The following table sets forth the costs and expenses to be paid by the Registrant, other than the estimated writing discount, in connection with the sale of the shares of common stock being registered hereby. All amounts are estimates except for the SEC registration fee, the FINRA filing fee, and the listing fee.
| SEC registration fee |
$ | * | ||
| FINRA filing fee |
* | |||
| listing fee |
* | |||
| Printing and engraving |
* | |||
| Legal fees and expenses |
* | |||
| Accounting fees and expenses |
* | |||
| Road show expenses |
* | |||
| Transfer agent and registrar fees and expenses |
* | |||
| Miscellaneous expenses |
* | |||
|
|
|
|||
| Total |
$ | * | ||
|
|
|
| * | To be provided by amendment. |
| ITEM 14. | INDEMNIFICATION OF DIRECTORS AND OFFICERS. |
Section 145 of the Delaware General Corporation Law, or DGCL, authorizes a court to award, or a company’s board of directors to grant, indemnity to directors and officers under certain circumstances and subject to certain limitations. The terms of Section 145 of the DGCL are sufficiently broad to permit indemnification under certain circumstances for liabilities, including reimbursement of expenses incurred, arising under the Securities Act.
As permitted by the DGCL, the Registrant’s restated certificate of incorporation that will be in effect following the completion of this offering contains provisions that eliminate the personal liability of its directors for monetary damages for any breach of fiduciary duties as a director, except liability for the following:
| • | any breach of the director’s duty of loyalty to the Registrant or its stockholders; |
| • | acts or omissions not in good faith or that involve intentional misconduct or a knowing violation of law; |
| • | under Section 174 of the DGCL (regarding unlawful dividends and stock purchases); or |
| • | any transaction from which the director derived an improper personal benefit. |
As permitted by the DGCL, the Registrant’s restated bylaws that will be in effect following the completion of this offering provide that:
| • | the Registrant is required to indemnify its directors and officers to the fullest extent permitted by the DGCL, subject to very limited exceptions; |
II-1
| • | the Registrant may indemnify its other employees and agents as set forth in the DGCL; |
| • | the Registrant is required to advance expenses, as incurred, to its directors and officers in connection with a legal proceeding to the fullest extent permitted by the DGCL, subject to very limited exceptions; and |
| • | the rights conferred in the restated bylaws are not exclusive. |
Prior to this offering, the Registrant has entered into indemnification agreements with each of its current directors and executive officers to provide these directors and executive officers additional contractual assurances regarding the scope of the indemnification set forth in the Registrant’s restated certificate of incorporation and restated bylaws and to provide additional procedural protections. At present, there is no pending litigation or proceeding involving a director, executive officer, or employee of the Registrant regarding which indemnification is sought. Reference is also made to the underwriting agreement filed as Exhibit 1.1 to this Registration Statement, which provides for the indemnification of executive officers, directors, and controlling persons of the Registrant against certain liabilities. The indemnification provisions in the Registrant’s restated certificate of incorporation and restated bylaws and the indemnification agreements entered into or to be entered into between the Registrant and each of its directors and executive officers may be sufficiently broad to permit indemnification of the Registrant’s directors and executive officers for liabilities arising under the Securities Act.
The Registrant has directors’ and officers’ liability insurance for its directors and officers.
Certain of the Registrant’s directors are also indemnified by their employers with regard to their service on the Registrant’s board of directors.
Reference is made to the following documents filed as exhibits to this Registration Statement regarding relevant indemnification provisions described above and elsewhere herein:
| Exhibit Document |
Number | |||
| Form of Underwriting Agreement. |
1.1 | |||
| Form of Restated Certificate of Incorporation of the Registrant, to be effective immediately prior to the completion of this offering. |
3.2 | |||
| Form of Restated Bylaws of the Registrant, to be effective immediately prior to completion of this offering. |
3.4 | |||
| Amended and Restated Investors’ Rights Agreement by and among the Registrant and certain security holders of the Registrant dated December 15, 2014. |
4.2 | |||
| Form of Indemnification Agreement. |
10.1 | |||
| ITEM 15. | RECENT SALES OF UNREGISTERED SECURITIES. |
From January 31, 2014 through January 31, 2017, the Registrant has issued the following securities:
| 1. | From January 31, 2014 and through January 31, 2017, the Registrant granted options to employees, directors, consultants, and other service providers to purchase an aggregate of 28,441,251 shares of common stock under its Amended and Restated 2004 Equity Incentive Plan, or 2004 Plan, with per share exercise prices ranging from $2.04 to $3.05 per share. |
| 2. | From January 31, 2014 through January 31, 2017, employees, directors, consultants, and other service providers of the Registrant exercised options granted under the 2004 Plan |
II-2
| aggregating 9,705,866 shares of common stock with exercise prices ranging from $0.12 per share to $3.05 per share for an aggregate exercise price of approximately $4.6 million. |
| 3. | In December 2014, the Registrant issued and sold to 28 accredited investors an aggregate of 21,527,376 shares of Series G preferred stock, at a purchase price of $3.2977 per share, for aggregate consideration of approximately $71.0 million. In connection with the completion of the offering described in this Registration Statement, these shares of Series G preferred stock will convert into 21,527,376 shares of common stock. |
| 4. | In October 2014, the Registrant issued to 31 accredited investors an aggregate of 3,600,873 shares of common stock in connection with the acquisition of Walk Score, Inc. |
| 5. | In February 2014, the Registrant issued and sold to two accredited investors an aggregate of 220,587 shares of Series F preferred stock, at a purchase price of $2.4286 per share, for aggregate consideration of approximately $0.5 million. In connection with the completion of the offering described in this Registration Statement, these shares of Series F preferred stock will convert into 220,587 shares of common stock. |
Unless otherwise stated, the sales of the above securities were deemed to be exempt from registration under the Securities Act in reliance upon Section 4(a)(2) of the Securities Act (or Regulation D or Regulation S promulgated thereunder), or Rule 701 promulgated under Section 3(b) of the Securities Act as transactions by an issuer not involving any public offering or pursuant to benefit plans and contracts relating to compensation as provided under Rule 701. The recipients of the securities in each of these transactions represented their intentions to acquire the securities for investment only and not with a view to or for sale in connection with any distribution thereof, and appropriate legends were placed upon the stock certificates issued in these transactions.
| ITEM 16. | EXHIBITS AND FINANCIAL STATEMENT SCHEDULES. |
(a) Exhibits.
| Exhibit Number |
Exhibit Title | |
| 1.1* |
Form of Underwriting Agreement. | |
| 3.1 |
Amended and Restated Certificate of Incorporation, as currently in effect. | |
| 3.2* |
Form of Restated Certificate of Incorporation to be effective immediately prior to the completion of this offering. | |
| 3.3 |
Amended and Restated Bylaws, as currently in effect. | |
| 3.4* |
Form of Restated Bylaws to be effective immediately prior to the completion of this offering. | |
| 4.1* |
Form of Common Stock Certificate. | |
| 4.2 |
Amended and Restated Investors’ Rights Agreement by and among the Registrant and certain security holders of the Registrant dated December 15, 2014. | |
| 5.1* |
Opinion of Fenwick & West LLP. | |
| 10.1* |
Form of Indemnification Agreement. | |
| 10.2 |
Amended and Restated 2004 Equity Incentive Plan, and forms of award agreements thereunder. | |
| 10.3* |
2017 Equity Incentive Plan, and forms of award agreements thereunder. | |
| 10.4* |
Amended and Restated Offer Letter by and between the Registrant and Glenn Kelman, dated .. |
II-3
| Exhibit Number |
Exhibit Title | |
| 10.5* |
Amended and Restated Offer Letter by and between the Registrant and Bridget Frey, dated . | |
| 10.6* |
Amended and Restated Offer Letter by and between the Registrant and Scott Nagel, dated . | |
| 10.7* |
Office Lease by and between Registrant and Hill7 Developers, LLC, dated May 9, 2016. | |
| 21.1* |
List of Subsidiaries. | |
| 23.1* |
Consent of Fenwick & West LLP (included in Exhibit 5.1). | |
| 23.2* |
Consent of Deloitte & Touche LLP, Independent Registered Public Accounting Firm. | |
| 24.1* |
Power of Attorney (included on page II-5). |
| * | To be filed by amendment. |
(b) Financial Statement Schedule.
All financial statement schedules are omitted because they are not applicable or the information is included in the Registrant’s consolidated financial statements or related notes.
| ITEM 17. | UNDERTAKINGS. |
The undersigned Registrant hereby undertakes to provide to the underwriters at the closing specified in the underwriting agreement certificates in such denominations and registered in such names as required by the underwriters to permit prompt delivery to each purchaser.
Insofar as indemnification for liabilities arising under the Securities Act of 1933, as amended, may be permitted to directors, officers, and controlling persons of the Registrant pursuant to the foregoing provisions, or otherwise, the Registrant has been advised that in the opinion of the Securities and Exchange Commission such indemnification is against public policy as expressed in the Securities Act of 1933, as amended, and is, therefore, unenforceable. In the event that a claim for indemnification against such liabilities (other than the payment by the Registrant of expenses incurred or paid by a director, officer or controlling person of the Registrant in the successful defense of any action, suit or proceeding) is asserted by such director, officer or controlling person in connection with the securities being registered, the Registrant will, unless in the opinion of its counsel the matter has been settled by controlling precedent, submit to a court of appropriate jurisdiction the question whether such indemnification by it is against public policy as expressed in the Securities Act of 1933, as amended, and will be governed by the final adjudication of such issue.
The undersigned Registrant hereby undertakes that:
(1) For purposes of determining any liability under the Securities Act of 1933, as amended, the information omitted from the form of prospectus filed as part of this registration statement in reliance upon Rule 430A and contained in a form of prospectus filed by the Registrant pursuant to Rule 424(b)(1) or (4) or 497(h) under the Securities Act shall be deemed to be part of this registration statement as of the time it was declared effective.
(2) For the purpose of determining any liability under the Securities Act of 1933, as amended, each post-effective amendment that contains a form of prospectus shall be deemed to be a new registration statement relating to the securities offered therein, and the offering of such securities at that time shall be deemed to be the initial bona fide offering thereof.
II-4
SIGNATURES
Pursuant to the requirements of the Securities Act of 1933, as amended, the Registrant has duly caused this Registration Statement to be signed on its behalf by the undersigned, thereunto duly authorized, in the City of Seattle, State of Washington, on , 2017.
| REDFIN CORPORATION | ||
| By: |
| |
| Glenn Kelman | ||
| President and Chief Executive Officer | ||
POWER OF ATTORNEY
KNOW ALL PERSONS BY THESE PRESENTS, that each person whose signature appears below hereby constitutes and appoints Glenn Kelman and Chris Nielsen, and each of them, as his or her true and lawful attorneys-in-fact, proxies and agents, each with full power of substitution, for him or her in any and all capacities, to sign any and all amendments to this Registration Statement (including post-effective amendments or any abbreviated Registration Statement and any amendments thereto filed pursuant to Rule 462(b) increasing the number of securities for which registration is sought), and to file the same, with all exhibits thereto and other documents in connection therewith, with the Securities and Exchange Commission, granting unto said attorneys-in-fact, proxies and agents full power and authority to do and perform each and every act and thing requisite and necessary to be done in connection therewith, as fully for all intents and purposes as he or her might or could do in person, hereby ratifying and confirming all that said attorneys-in-fact, proxies and agents, or their or his or her substitute or substitutes, may lawfully do or cause to be done by virtue hereof.
Pursuant to the requirements of the Securities Act of 1933, as amended, this Registration Statement has been signed by the following persons in the capacities and on the date indicated:
|
Name |
Title |
Date | ||
|
Glenn Kelman |
President, Chief Executive Officer and Director (Principal Executive Officer) | , 2017 | ||
|
Chris Nielsen |
Chief Financial Officer (Principal Financial and Accounting Officer) | , 2017 | ||
|
Robert Mylod |
Chairman of the Board of Directors | , 2017 | ||
|
Robert Bass |
Director | , 2017 | ||
|
Julie Bornstein |
Director | , 2017 | ||
|
Andrew Goldfarb |
Director | , 2017 | ||
II-5
|
Name |
Title |
Date | ||
|
Paul Goodrich |
Director | , 2017 | ||
|
Austin Ligon |
Director | , 2017 | ||
|
James Slavet |
Director | , 2017 | ||
|
Selina Tobaccowala |
Director | , 2017 | ||
II-6
EXHIBIT INDEX
| Exhibit Number |
Exhibit Title | |
| 1.1* |
Form of Underwriting Agreement. | |
| 3.1 |
Amended and Restated Certificate of Incorporation, as currently in effect. | |
| 3.2* |
Form of Restated Certificate of Incorporation to be effective immediately prior to the completion of this offering. | |
| 3.3 |
Amended and Restated Bylaws, as currently in effect. | |
| 3.4* |
Form of Restated Bylaws to be effective immediately prior to the completion of this offering. | |
| 4.1* |
Form of Common Stock Certificate. | |
| 4.2 |
Amended and Restated Investors’ Rights Agreement by and among the Registrant and certain security holders of the Registrant dated December 15, 2014. | |
| 5.1* |
Opinion of Fenwick & West LLP. | |
| 10.1* |
Form of Indemnification Agreement. | |
| 10.2 |
Amended and Restated 2004 Equity Incentive Plan, and forms of award agreements thereunder. | |
| 10.3* |
2017 Equity Incentive Plan, and forms of award agreements thereunder. | |
| 10.4* |
Amended and Restated Offer Letter by and between the Registrant and Glenn Kelman, dated . | |
| 10.5* |
Amended and Restated Offer Letter by and between the Registrant and Bridget Frey, dated . | |
| 10.6* |
Amended and Restated Offer Letter by and between the Registrant and Scott Nagel, dated . | |
| 10.7* |
Office Lease by and between Registrant and Hill7 Developers, LLC, dated May 9, 2016. | |
| 21.1* |
List of Subsidiaries. | |
| 23.1* |
Consent of Fenwick & West LLP (included in Exhibit 5.1). | |
| 23.2* |
Consent of Deloitte & Touche LLP, Independent Registered Public Accounting Firm. | |
| 24.1* |
Power of Attorney (included on page II-5). |
| * | To be filed by amendment. |