UNITED STATES
SECURITIES AND EXCHANGE COMMISSION
Washington, D.C. 20549
FORM
(Amendment No. 1)
(Mark One)
For the fiscal year ended
or
For the transition period from ___ to ___
Commission file number
(Exact name of registrant as specified in its charter)
| ||
(State or other jurisdiction of | (I.R.S. Employer Identification No.) |
| ||
(Address of Principal Executive Offices) | (Zip Code) |
( | |||
Registrant’s telephone number, including area code |
Securities registered pursuant to Section 12(b) of the Act:
Title of each class |
| Trading Symbol |
| Name of each exchange on which registered |
Securities registered pursuant to Section 12(g) of the Act: None
Indicate by check mark if the registrant is a well-known seasoned issuer, as defined in Rule 405 of the Securities Act. | ☒ |
Indicate by check mark if the registrant is not required to file reports pursuant to Section 13 or 15(d) of the Act. | ☐ Yes ☒ |
Indicate by check mark whether the registrant (1) has filed all reports required to be filed by Section 13 or 15(d) of the Securities Exchange Act of 1934 during the preceding 12 months (or for such shorter period that the registrant was required to file such reports), and (2) has been subject to such filing requirements for the past 90 days. | ☒ |
Indicate by check mark whether the registrant has submitted electronically every Interactive Data File required to be submitted pursuant to Rule 405 of Regulation S-T (§232.405 of this chapter) during the preceding 12 months (or for such shorter period that the registrant was required to submit such files). | ☒ |
Indicate by check mark whether the registrant is a large accelerated filer, an accelerated filer, a non-accelerated filer, or a smaller reporting company. See the definitions of “large accelerated filer,” “accelerated filer” and “smaller reporting company” in Rule 12b-2 of the Exchange Act. (Check one): |
☒ | Accelerated filer | ☐ | |
Non-accelerated filer | ☐ | Smaller reporting company | |
Emerging growth company |
If an emerging growth company, indicate by check mark if the registrant has elected not to use the extended transition period for complying with any new or revised financial accounting standards provided pursuant to Section 13(a) of the Exchange Act.☐ | ☐ |
Indicate by check mark whether the registrant has filed a report on and attestation to its management’s assessment of the effectiveness of its internal control over financial reporting under Section 404(b) of the Sarbanes-Oxley Act (15 U.S.C. 7262(b)) by the registered public accounting firm that prepared or issued its audit report. | |
If securities are registered pursuant to Section 12(b) of the Act, indicate by check mark whether the financial statement of the registrant included in the filing reflect the correction of an error to previously issued financial statements. | |
Indicate by check mark whether any of those error corrections are restatements that required a recovery analysis of incentive-based compensation received by any of the registrant’s executive officers during the relevant recovery period pursuant to §240.10D-1(b). | ☐ |
Indicate by check mark whether the registrant is a shell company (as defined in Rule 12b-2 of the Exchange Act). | |
As of the last business day of the registrant’s most recently completed second fiscal quarter, the aggregate market value of the registrant’s common stock held by its non-affiliates, computed by reference to the price at which the common stock was last sold, was $ | |
The registrant had | |
DOCUMENTS INCORPORATED BY REFERENCE | |
None. |
EXPLANATORY NOTE
This Amendment No. 1 on Form 10-K/A (“Form 10-K/A”) to the Annual Report on Form 10-K of Redfin Corporation for the fiscal year ended December 31, 2024, filed with the Securities and Exchange Commission (the “SEC”) on February 27, 2025 (the “Original Form 10-K”), is being filed solely for the purpose of including the information required by Part III of Form 10-K that we did not include in the Original Form 10-K in reliance on General Instruction G(3) to Form 10-K. We are filing this Form 10-K/A to include Part III information in our Form 10-K because we do not intend to file a definitive proxy statement for an annual meeting of shareholders containing such information within 120 days after the end of our fiscal year ended December 31, 2024.
In addition, in connection with the filing of this Form 10-K/A and pursuant to the rules of the SEC, we are including with this Form 10-K/A new certifications of our principal executive officer and principal financial officer pursuant to Section 302 of the Sarbanes-Oxley Act of 2002. Item 15 of Part IV has also been amended to reflect the filing of these new certifications.
Except as described above, this Form 10-K/A does not modify or update the disclosures in, or any exhibits to, the Original Form 10-K. Furthermore, this Form 10-K/A does not change any previously reported financial results, nor does it reflect any events which occurred subsequent to the filing of the Original Form 10-K. Information not affected by this Form 10-K/A remains unchanged and reflects the disclosures made at the time the Original Form 10-K was filed.
As used in this Form 10-K/A, the terms “Redfin,” “we,” “us” and “our” refer to Redfin Corporation and its subsidiaries taken as a whole, unless otherwise noted or unless the context indicates otherwise.
Deloitte & Touche LLP (“Deloitte”) issued reports on our consolidated financial statements, and the effectiveness of our internal control over financial reporting, within the Original Form 10-K. As this Amendment speaks to the date of the Original Form 10-K, Deloitte’s reports speak only as to February 27, 2025. We have made no substantive changes to the Original Form 10-K other than those noted above.
Redfin Corporation
Amendment No. 1 on Form 10-K/A
To the Annual Report on Form 10-K
For the Year Ended December 31, 2024
Table of Contents
| |||
1 | |||
5 | |||
Security Ownership of Certain Beneficial Owners and Management and Related Stockholder Matters | 29 | ||
Certain Relationships and Related Transactions, and Director Independence | 32 | ||
34 | |||
35 | |||
36 |
PART III
Item 10. Directors, Executive Officers and Corporate Governance
Our Board of Directors
Robert Bass, age 75, has been one of our directors since October 2016. Mr. Bass was a partner at Deloitte & Touche, a multinational accounting firm, from 1982 to 2012, and served as vice chairman from 2006 to 2012. Mr. Bass is currently on the board of directors of three other public companies: Groupon, an e-commerce marketplace, Bowlero, a bowling center operator, and BlackStone Secured Lending Fund, a business development company. Mr. Bass is also currently on the board of trustees of private equity funds and on the board of directors of a privately held company. Mr. Bass has a bachelor’s degree from Emory University and an MBA from the Columbia University Graduate School of Business. We believe that Mr. Bass’s knowledge of public company financial reporting and accounting and his accounting firm leadership experience qualifies him to serve on our board of directors.
Julie Bornstein, age 55, has been one of our directors since October 2016. Since July 2023, Ms. Bornstein has served as Co-founder and CEO of a private technology startup company. Until January 2023, Ms. Bornstein served as Senior Vice President and Chief Shopping Officer of Pinterest, Inc., a digital visual inspiration platform. Ms. Bornstein joined Pinterest when it acquired The Yes Platform, Inc., an AI-powered online shopping platform she co-founded and for which she served as Chief Executive Officer from February 2018 until its acquisition in June 2022. Previously, Ms. Bornstein was chief operating officer at Stitch Fix, an online personal styling services company, from March 2015 to September 2017. Before that, Ms. Bornstein was chief marketing officer and chief digital officer at Sephora, a beauty products retailer. Ms. Bornstein is currently on the board of directors of two other public companies: Sweetgreen, a restaurant chain, and WW International, a weight loss and lifestyle company. Ms. Bornstein has a bachelor’s degree from Harvard University and an MBA from Harvard Business School. We believe that Ms. Bornstein’s senior leadership experience at various online services companies qualifies her to serve on our board of directors.
Kerry D. Chandler, age 61, has been one of our directors since August 2020. Until June 2023, Ms. Chandler served as chief human resources officer of Bombas, a premium basics apparel company. Previously, Ms. Chandler was chief human resources officer of Endeavor, a global sports and entertainment company, from December 2018 to January 2022 and was chief human resources officer of Under Armour, a sports apparel and footwear company, from January 2015 to November 2018. Before that, Ms. Chandler was global head of human resources at Christie’s, executive vice president of human resources at the National Basketball Association, and senior vice president of human resources at ESPN (a part of The Walt Disney Company) and Hong Kong Disneyland, as well as various human resources roles of increasing responsibility at IBM, Motorola, Exxon, and McDonnell Douglas. Ms. Chandler is also on the board of directors of Lyra Health. Ms. Chandler has a bachelor’s degree from Lincoln University, a master’s degree from Washington University in St. Louis, and a master’s degree from McGill University. We believe that Ms. Chandler’s human resources experience across high-growth companies qualifies her to serve on our board of directors.
Glenn Kelman, age 54, has been one of our directors since March 2006. Since September 2005, Mr. Kelman has been our chief executive officer. Previously, Mr. Kelman was vice president of marketing and product management at Plumtree Software, which he also co-founded. Mr. Kelman has a bachelor’s degree from the University of California at Berkeley. We believe that Mr. Kelman’s deep understanding of our company and his real estate industry experience qualifies him to serve on our board of directors.
Austin Ligon, age 74, has been one of our directors since September 2010. Since 2006, Mr. Ligon has been a venture investor. Previously, Mr. Ligon served as president and chief executive officer at CarMax, a used vehicle retailer, which he also co-founded. Mr. Ligon has bachelor’s and master’s degrees from the University of Texas at Austin and an MBA from the Yale School of Management. We believe that Mr. Ligon’s experience scaling and managing CarMax from startup to nationwide operations, with extensive online presence and nationally distributed field operations, qualifies him to serve on our board of directors.
1
David Lissy, age 59, has been one of our directors since February 2018 and has served as chairman of our board since July 2020. Since January 2020, Mr. Lissy has been chairman of Bright Horizons Family Solutions, a publicly traded provider of employer sponsored childcare, back-up care, and educational advisory services company, where he was also executive chairman from January 2018 to December 2019 and chief executive officer from 2002 to January 2018. Mr. Lissy is also a director at several privately held companies and chair of the board of trustees of Ithaca College, where he received his bachelor’s degree. We believe that Mr. Lissy’s experience leading a publicly traded company, as both a director and an executive officer, qualifies him to serve on our board of directors.
Brad Singer, age 58, has been one of our directors since March 2022. Mr. Singer was chief operating officer at ValueAct Capital, a venture capital firm, from May 2012 to December 2021 and served as a partner from May 2012 to June 2021. Previously, Mr. Singer was senior executive vice president and chief financial officer at Discovery Communications, a media company, and chief financial officer & treasurer at American Tower, a telecommunications provider. Mr. Singer is currently on the board of directors of two other public companies: Sweetgreen, a restaurant chain, and Crown Castle, a telecommunications provider. Mr. Singer is not standing for re-election as a director of Crown Castle at its 2025 annual meeting. Mr. Singer has a bachelor’s degree from the University of Virginia and an MBA from Harvard Business School. We believe that Mr. Singer’s experience as a public equity investor and a senior finance executive, including as the chief financial officer of a large publicly traded company, qualifies him to serve on our board of directors.
James Slavet, age 55, has been one of our directors since November 2009. Since April 2006, Mr. Slavet has been a partner of Greylock Partners, a venture capital firm. Previously, Mr. Slavet was vice president and general manager in search and marketplace at Yahoo!, an online platform, and chief operating officer at Guru, a freelance marketplace, which he also founded. Mr. Slavet has a bachelor’s degree from Brown University and an MBA from Harvard Business School. We believe that Mr. Slavet’s experience advising and managing growth-oriented technology companies, including as an operating executive, qualifies him to serve on our board of directors.
Selina Tobaccowala, age 48, has been one of our directors since January 2014. Since May 2023, Ms. Tobaccowala has served as Co-founder and CEO of HomeBoost, a climate technology company. Until May 2022, Ms. Tobaccowala served as chief digital officer at Openfit, a fitness company. Previously, Ms. Tobaccowala was chief executive officer at Gixo, a fitness company, which she also co-founded, from April 2016 to August 2019. Before that, Ms. Tobaccowala was president and chief technology officer at SurveyMonkey, a software company, senior vice president of product & technology at Ticketmaster Europe, a mobile ticket company, and vice president of engineering at Evite, a social planning website, which she also co-founded. Ms. Tobaccowala is currently on the board of directors of Voltus, a virtual power plant operator. Ms. Tobaccowala has a bachelor’s degree from Stanford University. We believe that Ms. Tobaccowala’s technology background and senior leadership experience at multiple online services companies qualifies her to serve on our board of directors.
Our Executive Officers
See “Our Executive Officers” under Item 1 of the Original Form 10-K for information on our executive officers.
Committees of our Board of Directors
Our board of directors has established an audit committee, a compensation committee, and a nominating and corporate governance committee. Please see below for information regarding each committee.
2
Each committee operates under a written charter that outlines the committee’s duties and responsibilities. Each committee periodically reviews and updates, as necessary, its charter to reflect the committee’s evolving role. You can obtain the charter for each committee in the “Governance” section of our investor relations website at investors.redfin.com.
Audit Committee | ||
Members |
| ● Robert Bass (Chair)* |
● Austin Ligon | ||
● Brad Singer | ||
2024 activity | ● Held 8 meetings | |
● Acted by unanimous written consent one time | ||
Responsibilities | ● Review and discuss with management our quarterly and annual financial results and the related earnings releases and earnings guidance distributed to the public | |
● Discuss with management and our independent auditors the selection, application, and disclosure of critical accounting policies and practices | ||
● Review and discuss with our independent auditors and management their periodic reviews of the adequacy and effectiveness of our accounting and financial reporting processes and systems of internal control, including any significant deficiencies and material weaknesses in their design or operation | ||
● Direct responsibility for the appointment, compensation, retention, oversight and, if appropriate, replacement of our independent auditors | ||
● Review and assess the adequacy of our cybersecurity policies and procedures |
* Our board of directors has determined that Mr. Bass qualifies as an “audit committee financial expert,” as the SEC has defined that term.
Compensation Committee | ||
Members |
| ● James Slavet (Chair) |
● Kerry D. Chandler | ||
● Selina Tobaccowala | ||
2024 activity | ● Held three meetings | |
● Acted by unanimous written consent four times | ||
Responsibilities | ● Review our overall compensation strategy, including base salary, incentive compensation, and equity-based compensation, to assure that it promotes stockholder interests, supports our objectives, and provides for appropriate rewards and incentives for our management and employees | |
● Annually review and approve all cash-based and equity-based incentive compensation plans and arrangements for our executives | ||
● Annually review all director compensation and benefits for service on our board and committees and recommend to our board the form and amount of director compensation |
3
Nominating and Corporate Governance Committee | ||
Members |
| ● Julie Bornstein (Chair) |
● Robert Bass | ||
2024 activity | ● Held four meetings | |
● Acted by unanimous written consent one time | ||
Responsibilities | ● Develop and recommend policies regarding our director nomination process | |
● Identify, evaluate, and select, or recommend that our board selects, nominees for election or appointment to our board | ||
● Periodically review and assess the adequacy of our Corporate Governance Guidelines, Code of Conduct and Ethics, and any other compliance policies that the committee deems appropriate |
Delinquent Section 16(a) Reports
During 2024, Austin Ligon, Bradley Singer, James Slavet, Julie Bornstein, Robert Bass, David Lissy, Kerry Chandler and Selina Tobaccowala, each failed to timely file one Form 4, which resulted in the late reporting of their receipt of a grant of restricted stock units.
Code of Conduct and Ethics
We have adopted a code of conduct and ethics that applies to all of our directors and employees, including the persons serving as our principal executive officer, principal financial officer, and principal accounting officer. The code of conduct and ethics is available under the “Governance” section of our investor relations website located at investors.redfin.com. We will disclose any amendment to, or waiver from, our code of conduct and ethics that pertains to the persons serving as our principal executive officer, principal financial officer, or principal accounting officer on the above-referenced website.
4
Item 11. Executive Compensation
Executive Compensation
Compensation Discussion and Analysis
This section provides information about the 2024 compensation of the named executive officers, or NEOs, listed below.
Name |
| Position |
Glenn Kelman | Chief executive officer | |
Chris Nielsen | Chief financial officer | |
Bridget Frey | Chief technology officer | |
Anthony Kappus | Chief of legal affairs and digital revenue | |
Christian Taubman | Chief growth officer |
Our Business
Our mission is to redefine real estate in the consumer’s favor. Representing customers in over 100 markets in the United States and Canada, we are a residential real estate brokerage, helping people buy and sell homes. We pair our agents with proprietary technology to create a service that is faster, better, and costs less. We use the same combination of technology and local service to originate mortgage loans and offer title and settlement services. In addition, our digital platforms connect consumers with available apartments and houses for rent.
On March 9, 2025, we entered into an Agreement and Plan of Merger (the “Merger Agreement”) with Rocket Companies, Inc., a Delaware corporation (“Rocket”), and Neptune Merger Sub, Inc., a Delaware corporation and wholly owned subsidiary of Rocket (“Merger Sub”). Pursuant to the Merger Agreement, and upon the terms and subject to the conditions therein and in accordance with the Delaware General Corporation Law, Merger Sub will merge with and into us (the “Merger”), and we will survive the Merger and continuing as a wholly owned subsidiary of Rocket. The closing of the Merger is subject to approval by our stockholders and the satisfaction of other closing conditions, including the expiration or termination of the applicable waiting period under the Hart-Scott-Rodino Antitrust Improvements Act of 1976.
Compensation for the Chief Executive Officer
Glenn Kelman has been Redfin’s chief executive officer since 2005. Since 2021, at Mr. Kelman’s request, his compensation has been limited entirely to his base salary of roughly $300,000. Mr. Kelman last received an annual bonus award in 2020, and he has indicated that he intends to decline any annual cash bonus until the company reaches profitability. Mr. Kelman last received a long-term equity award in 2019, in the form of performance-based stock options. Consistent with prior years, in 2024 he requested - and the compensation committee agreed – not to participate in the bonus plan and not to receive any equity grants. Mr. Kelman has no unvested equity as of year-end 2024.
Our Compensation Philosophy
We strive to provide competitive total pay packages that allow us to attract and retain the most qualified individuals to lead our business and to reward them largely based on our short-term and long-term financial performance and the value we create for our stockholders.
Consistent with this philosophy, in 2024 our compensation committee aimed to pay our NEOs (other than the CEO) mostly via equity rather than cash to focus their efforts on increasing our company’s value over the long term. Further, over half of the NEOs’ equity compensation was performance-based. For more information, see “2024 Executive Compensation—Long-Term Equity Compensation.”
5
Stockholder Advisory Vote
In 2024, our stockholders approved on an advisory basis the compensation of our NEOs with 96.5% support rate. We value the opinions of our stockholders, and our compensation committee and our board of directors considered the outcome of the advisory vote in determining to maintain substantially similar practices to date, and will continue to do so in the future.
Who is Involved in Setting NEO Compensation
Role of the Compensation Committee
The compensation committee of our board of directors is primarily responsible for setting the compensation of our NEOs. The committee’s responsibilities include determining:
● | the dollar amount for each element of our NEOs’ direct and target compensation; |
● | the structure, metrics, and targets we use for our performance-based compensation elements; and |
● | the group of companies we use to evaluate market-competitive rates of compensation. |
David Lissy, our board chairman, assists the committee in determining Mr. Kelman’s compensation.
When discharging its responsibilities, the committee relies on input from management and our independent compensation consultant, whose roles are discussed below. After reviewing and evaluating this input, the committee recommends to our board of directors the compensation to be paid to our NEOs, and our board approves the compensation following deliberation.
Role of Management
Management provides our compensation committee with its perspectives on certain aspects of our NEOs’ compensation, including the relevant metrics and targets to use in our performance-based compensation elements and the companies that should constitute our compensation peers. Additionally, for each NEO except himself, Mr. Kelman provides the committee his review of the NEO’s individual performance and a recommendation regarding the NEO’s compensation. The compensation committee’s recommendations are informed by each NEO’s performance and data regarding market levels of compensation for executives at our peer group with comparable roles and scope of responsibility. Mr. Kelman does not participate in deliberations by our board of directors or the committee on his own compensation.
Role of the Compensation Consultant
For 2024, our compensation committee engaged Compensia, a national executive compensation consultant. In connection with engaging Compensia, the committee considered the independence factors established by Nasdaq and the SEC and concluded that the engagement did not create any conflicts of interest and that Compensia was independent.
In 2024, Compensia supported the committee by providing input on the compensation of certain of our officers, including our NEOs, and our non-employee directors. Specifically, our compensation committee directed Compensia to:
● | update the peer group used to determine the competitive market for executive and director compensation; |
● | assess the competitiveness of our executive compensation program; |
● | assess competitive short-term and long-term incentive practices for executives; and |
● | assess the competitiveness of our director compensation program. |
6
Considerations in Setting NEO Compensation
Factors Considered by the Compensation Committee
Our compensation committee relied primarily on its subjective consideration of various factors to set the amounts of our NEOs’ 2024 compensation. First and foremost, the committee, together with our board chairman, evaluated our chief executive officer’s performance and the committee considered our chief executive officer’s evaluation of each other NEO’s performance. The committee also considered:
● | each NEO’s scope of responsibility; |
● | each NEO’s historical compensation with us, including the retentive value of prior equity awards; |
● | internal pay equity; and |
● | how our compensation peers pay executives with similar responsibilities, as described in more detail below. |
Finally, with respect to our chief executive officer’s compensation, considering his ultimate responsibility for execution of our business plans, the committee considered our lack of profitability, our culture of thrift and Mr. Kelman’s request that his 2024 compensation be limited to base salary.
How We Use Market Data
Our compensation peer group consists of companies that are similar to us in terms of industry, revenue, enterprise value, gross profit, gross margin, product or service offering, and headquarters location. The compensation committee, with assistance from Compensia, reviews our peer group annually to ensure it is appropriate. To establish our peer group for purposes of our 2024 compensation decisions, the primary financial screens we used to inform our assessment of current and potential peer companies are whether they have an enterprise value between 0.25x and 4x Redfin’s enterprise value, revenue between 0.25x and 3x Redfin’s revenue, and gross profit between 0.33x and 3x Redfin’s gross profit.
For 2024, following our review of the primary peer group in October 2023, we decided not to make any changes and maintained the same set of companies that were in our 2023 peer group.
The companies listed below are referred to collectively as our primary peers for purposes of our 2024 compensation decisions.
2U |
| frontdoor |
| RE/MAX |
AppFolio | Guidewire Software | Shutterstock | ||
Bright Horizons Family Solutions | Marcus & Millichap | The RealReal | ||
CarGurus | Offerpad Solutions | Zillow Group | ||
Chegg | Opendoor Technologies | |||
Compass Envestnet | Overstock.com | |||
eXp World Holdings | Q2 |
Where appropriate to make up for a limited sample size of data within our primary peer group, Compensia provided the compensation committee with additional comparative market data for a broader group of 36 public companies, including 12 of our primary peers, from the Radford Global Technology Survey. These companies had revenues, enterprise values, and gross profit that were consistent with those of our primary peers.
The compensation committee did not determine compensation amounts for the NEOs based solely on a comparison against the primary peer group or the Radford peer data. Rather, the committee used this data to develop a general understanding of our peers’ and broader market compensation practices, and then relied on its judgment, including consideration of the factors described above, to set each NEO’s compensation.
7
Elements of Our NEOs’ Direct Compensation
The table below describes the principal elements of our executive compensation program in 2024.
Element |
| Description |
| Objective |
| Recipient |
Base salary | Fixed cash amount | ● Provide a guaranteed level of income | Each NEO | |||
Executive bonus plan | Cash award that varies based on our performance | ● Provide opportunity to earn additional cash compensation by achievement of certain annual company goals | Each NEO, other than CEO | |||
Restricted stock unit, or RSU, awards | RSUs vest into shares of our common stock | ● Align officers’ and stockholders’ interests by rewarding creation of long-term stockholder value ● Retention through use of a multi-year vesting schedule | Each NEO, other than CEO | |||
Performance stock unit, or PSU, awards | PSUs, if earned, settle in shares of our common stock at the end of a three-year period based on our achievement of defined goals during that period | ● Incentivize long-term company achievements ● Align officers’ and stockholders’ interests by rewarding creation of long-term stockholder value | Each NEO, other than CEO |
2024 Executive Compensation
Target Cash Compensation
The cash component of the NEOs’ target total direct compensation consists of base salary and, other than for Mr. Kelman, a potential payment under our executive bonus plan, where each NEO has an opportunity to earn a cash-based incentive award based on our actual performance as measured against prescribed financial or operating goals. For each year’s executive bonus plan, our compensation committee can establish goals that apply to our company as a whole or to any of our departments. Goals may vary from year to year at the committee’s discretion.
Our compensation committee generally sets our NEOs’ target cash compensation in March of each year, after considering the factors described under “Considerations in Setting NEO Compensation” above, including looking at peer group data to gain an understanding of target cash compensation for our compensation peers’ executives. In addition, it may adjust compensation at other times as appropriate in light of hiring, promotions or other changes in an executive’s role or responsibilities. The increase to the target cash compensation for Mr. Kappus in January 2024 reflected his expanded role leading our digital revenue team in addition to his existing leadership of legal affairs. The increase for Mr. Taubman in March 2024 reflected internal equity, individual performance and competitive market considerations relative to similarly situated executives at peer group companies.
Base Salary
After determining the target cash compensation for each NEO, our compensation committee set the 2024 base salary amounts shown in the table below. Among other things, the committee considered Mr. Kelman’s request for no or a minimal increase to his base salary.
NEO |
| 2024 base salary |
| 2023 base salary | ||
Glenn Kelman | $ | 300,000 | $ | 300,000 | ||
Chris Nielsen | $ | 500,000 | $ | 500,000 | ||
Bridget Frey | $ | 450,000 | $ | 450,000 | ||
Anthony Kappus | $ | 440,000 | $ | 400,000 | ||
Christian Taubman | $ | 450,000 | $ | 400,000 |
8
Annual Incentive Cash-Based Award
Target Opportunities
The compensation committee established target awards under the executive bonus plan for each NEO other than the CEO as shown below. The target awards for other applicable NEOs were increased relative to their 2023 target awards to better reflect their individual performance, internal equity, and alignment to the target bonus awards offered to similarly situated executives at our peer group.
| Target payment under 2024 executive bonus |
| Target payment under 2023 executive bonus | |||
NEO | plan(1) | plan(1) | ||||
Glenn Kelman | $ | — | $ | — | ||
Chris Nielsen | $ | 375,000 | $ | 375,000 | ||
Bridget Frey | $ | 292,500 | $ | 270,000 | ||
Anthony Kappus | $ | 286,000 | $ | 240,000 | ||
Christian Taubman | $ | 292,500 | $ | 240,000 |
Our 2024 executive bonus plan had a potential payout ranging from 0 to 200% of an NEO’s target, depending upon our achievement of the financial and diversity goals described below.
Performance Metrics and Results
Financial goals accounted for 90% of the 2024 annual incentive payout, and diversity, equity, and inclusion goals, or DEI goals, accounted for the remaining 10%.
The financial goals, which were the same for all of the NEOs, measured our achievement of 2024 consolidated revenue (30% weight) and Adjusted EBITDA (60% weight) (as defined below). The compensation committee determined these financial metrics and weightings best reflected our priorities for the year, balancing growth with our drive towards improved efficiency and profitability. Adjusted EBITDA is a non-GAAP financial measure, which we define as net loss from continuing operations, adjusted for interest income and expense, income taxes, depreciation and amortization, stock-based compensation, and other various items. For a full reconciliation for Adjusted EBITDA to the most directly comparable financial measure stated in accordance with GAAP, please see our Original Form 10-K and Exhibit 99.1 to our Current Report on Form 8-K filed on February 27, 2025.
The 2024 diversity goals correspond with our focus on retaining and developing our managers who identify as people of color, reducing attrition of our Black agents, and actively servicing communities largely represented by people of color. Results for this metric are determined by the compensation committee upon its review of relevant data.
The table below details the threshold, target, and maximum goals, as well as the actual achievement, with respect to each metric.
Metric |
| Weight |
| Threshold |
| Target |
| Maximum |
| Actual |
| Achievement |
| ||||
Consolidated revenue |
| 30 | % | $ | 977,000 | $ | 1,148,000 | $ | 1,319,000 | $ | 1,043,000 |
| 16 | % | |||
Consolidated adjusted EBITDA |
| 60 | % | $ | (93,000) | $ | 10,000 | $ | 113,000 | $ | (27,000) |
| 44 | % | |||
DEI |
| 10 | % | $ | — | $ | — | $ | — | $ | — |
| 100-110 | % |
The compensation committee made specific findings to conclude the NEOs should receive 100%-110% of their annual bonuses attributable to our DEI goals (i.e., 10%-11% of their target bonuses). In particular, the executives took the following actions:
● | Successfully maintained the underrepresented employee population (URP) representation for the field organization and increased it by 0.5% for headquarters |
9
● | We outlined separate programs tailored to addressing programmatic gaps in both Field and HR groups |
o | Field- The field had a goal for 80% of the total requisitions filled in H2 2024 in five select markets to ensure at least one candidate from an underrepresented group completes a full interview loop with the hiring team for most requisitions. For these markets, 78 of 88 total roles have met the goal (88.6%) and as a result we have made 52 diverse hires. |
o | Headquarters- Headquarters focused on hiring roles in Atlanta. Once key policies were aligned to we were able to post 33 of our remaining 67 headquarters requisitions for the Atlanta office. This resulted in 4 URP and 2 POC hires in Atlanta. The other key policies around compensation and return to office were unable to be implemented based on the Zillow transaction and space availability. The headquarters leaders put in good faith efforts as indicated by the partial attainment of the Atlanta Hiring Hub goal by the headquarters leadership. |
2024 Annual Bonus Payouts
The table below shows the amount each NEO earned under our 2024 executive bonus plan.
|
| Achievement |
|
| ||||||||
of financial | Achievement | |||||||||||
goals (90% | of DEI goals | 2024 actual | ||||||||||
NEO | Target bonus | weight) | (10% weight) | bonus | ||||||||
Chris Nielsen | $ | 375,000 | $ | 225,000 | $ | 41,250 | $ | 266,250 | ||||
Bridget Frey | $ | 292,500 | $ | 175,000 | $ | 32,175 | $ | 207,675 | ||||
Anthony Kappus | $ | 286,000 | $ | 171,600 | $ | 31,460 | $ | 203,060 | ||||
Christian Taubman | $ | 292,500 | $ | 175,500 | $ | 32,175 | $ | 207,675 |
Long-Term Equity Compensation
Overview
In setting our NEOs’ target equity compensation, our compensation committee considered the factors described under “Our Considerations in Setting NEO Compensation” above. In addition, consistent with our approach introduced in 2023 to help manage equity dilution and to better align equity awards offered to similarly situated executives at our peer group, the compensation committee approved 2024 equity grants for the NEOs that reduced the value and proportion of RSU awards as a percentage of the total award and delivered them over a shorter vesting schedule. As a result, each NEO’s equity awards in 2024 were composed of 62.5% of PSUs (at target level achievement) and 37.5% of RSUs. The compensation committee believes this distribution of RSUs and PSUs balances three considerations: driving specific company performance goals, aligning executives’ interests with those of our stockholders, and retaining executive talent.
RSU awards. Our RSU awards are time-based, and will vest into shares of our common stock. Prior to 2023, our RSU awards followed a four-year vesting schedule, but the RSUs granted in 2024 (consistent with RSUs granted in 2023) will vest over two years instead to reflect the reduced value of those awards. The committee determined that this two-year vesting schedule was reasonable and necessary to retain key leaders in the near-term in light of reduced overall target value. Specifically, the RSUs were scheduled to vest in eight equal quarterly increments following the grant date in May 2024, so long as the recipient NEO continues to be employed by Redfin on each applicable vesting date.
PSU awards. The PSUs will be earned, or not, and settle into shares of our common stock based on our achievement against three pre-established performance objectives – two financial metrics and a TSR metric. Historically, goals for all metrics were set for, and performance was measured over, a three-year performance period. However, due to high volatility in the technology and real estate sectors, the compensation committee decided that, for the PSU awards granted beginning in 2023 (the “2023 PSUs”) and going forward it would be more practical to instead set annual goals for the financial metrics. Accordingly, the PSUs award granted in 2024 (the “2024 PSUs”) include three annual performance tranches, each with two financial performance goals that are established promptly following the start of each calendar year (2024, 2025 and 2026) and measured following the conclusion of such year. The two financial performance goals for calendar year 2024 were Adjusted EBITDA and market share. PSUs that are achieved based on the annual financial metrics will be “banked” until the end of the full three-year period, and not be eligible to vest until early 2027, regardless of our performance against the financial goals for the first two years. The relative TSR metric will be measured
10
for a single, approximately three-year performance period that started on May 28, 2024, the date of grant, and ends on December 31, 2026.
As noted above, the 2023 PSUs also included two financial metrics and a TSR metric, with the two financial metrics set at the start of each calendar year (2023, 2024, and 2025). Accordingly, the compensation committee established the 2024 Adjusted EBITDA and market share metrics for 2023 PSUs at the same time that it established the metrics for the 2024 PSUs.
The compensation committee believes that using three annual financial performance targets rather than a single three-year financial performance target will allow the committee to set rigorous but realistic goals that reflect prevailing market conditions. In particular, this design drives year-to-year accountability with new annual goals established for each fiscal year based on up-to-date market conditions while holding participants accountable for a three-year performance period via multi-year TSR performance goal.
Target Equity Awards
The table below sets forth our NEOs’ target equity compensation for 2024, except for our CEO who did not receive equity compensation in 2024 as noted above.
| 2024 equity compensation ($) |
| 2023 equity compensation ($) | |||||||||
|
|
| Target |
|
|
| Target | |||||
RSU | PSU | equity | RSU | PSU | equity | |||||||
NEO | award(1) | award(1) | compensation | award(1) | award(1) | compensation | ||||||
Chris Nielsen | 600,000 |
| 1,000,000 |
| 1,600,000 | 600,000 |
| 1,000,000 |
| 1,600,000 | ||
Bridget Frey | 600,000 |
| 1,000,000 |
| 1,600,000 | 600,000 |
| 1,000,000 |
| 1,600,000 | ||
Anthony Kappus | 480,000 |
| 800,000 |
| 1,280,000 | 480,000 |
| 800,000 |
| 1,280,000 | ||
Christian Taubman | 645,000 |
| 1,075,000 |
| 1,720,000 | 480,000 |
| 800,000 |
| 1,280,000 |
(1)To determine the number of shares underlying these RSU and PSU awards, we divided the dollar value of each award by $6.26, the average closing price of our common stock for the 30 trading days prior to the date our compensation committee approved the grants.
(2)The 2024 PSUs will have three one-year performance periods for the financial metrics, and a three-year performance period for the TSR metric. The 2024 PSU award values in this table reflect the total target value of all performance periods and metrics.
Because the 2024 PSUs include financial metrics with one-year financial performance goals that are set at the beginning of each of 2024, 2025 and 2026, plus a three-year TSR performance goal, the target values set forth in the table above differ from the reported PSU award grant date fair value in the Summary Compensation Table and the Grants of Plan-Based Awards Table below. The differences are due to the SEC requirement that PSU award values disclosed in the Summary Compensation Table and the Grants of Plan-Based Awards Table reflect the grant date fair value as determined under FASB ASC Topic 718, which stipulates that grant date is established when the underlying terms of the award are fixed. Likewise, the Summary Compensation Table and the Grants of Plan-Based Awards Table reflect the grant date fair value as determined under FASB ASC Topic 718 of the 2024 Adjusted EBITDA and market share metrics for 2023 PSUs.
Performance Metrics
Each performance objective has a threshold, target, and maximum goal, with corresponding payouts equal to 25%, 100%, and 200%, respectively, of the target number of PSUs for that objective. If we do not achieve the threshold level for an objective, then no PSUs allocated to that objective will be earned for the year. Achievement between each of the levels will be measured on a straight-line interpolation basis. As noted above, any PSUs that are earned at the end of the first two annual performance periods are “banked” and will not vest until the end of the full three-year performance period. Upon certification by the compensation committee of the results for the full three-year performance period, any earned PSUs will vest if the NEO continues to be employed by Redfin. Unearned PSUs for a performance period are forfeited and are not eligible to be earned in a future performance period.
11
The table below describes the three performance objectives for our PSUs for calendar year 2024 (the “2024 performance period”).
Performance objective |
| Weight |
| Performance |
| What it measures |
Adjusted EBITDA | 11.11% per year | one year | Our progress on our drive towards profitability | |||
Market share gain | 11.11% per year | one year | Our ability to grow our real estate services business | |||
Relative total shareholder return (TSR) compared to the S&P MidCap 400 Index | 33.33 | % | three years | Our achievement of long-term investment returns for our shareholders |
Adjusted EBITDA. The Adjusted EBITDA performance metric is Redfin’s total Adjusted EBITDA (Adjusted EBITDA) for a full year as is reported on Redfin’s audited consolidated financial statements for each such year. As discussed above, the compensation committee established the Adjusted EBITDA goal for the 2024 performance period (the “2024 Adjusted EBITDA Tranche”) for both the 2023 PSUs and the 2024 PSUs at the time it granted the 2024 PSUs.
Market share gain. Market share gain is our “U.S. Market Share by Units” for a full year, which is reported in our next year’s annual report. We calculate our market share gain by aggregating the number of brokerage transaction sides (buy-side or sell-side) and our partner transaction sides (buy-side or sell-side), which we collectively refer to as real estate services transactions. Then, in order to account for both the sell- and buy-side components of each transaction, we divide that value by two-times the number of U.S. homes sold. As discussed above, the compensation committee established the Market Share Gain goals for the 2024 performance period (the “2024 Market Share Tranche”) for both the 2023 PSUs and the 2024 PSUs at the time it granted the 2024 PSUs.
Relative total shareholder return (“TSR”). Relative TSR measures the change in our stock price relative to the change in stock prices for companies in the S&P 400 MidCap Index (adjusted to reflect any reinvested dividends). We will determine the change in stock price based on the average closing price for the 30 trading days at the end of the performance period relative to the 30 trading days immediately preceding the performance period. Only companies that were part of the S&P 400 MidCap Index and that remain publicly traded throughout the entire performance period will be considered. For our 2024 PSUs, the performance period began on May 28, 2024, which was the grant date for our 2024 PSU awards, and ends on December 31, 2026, to align with the end of the full financial performance period. The compensation committee established the TSR goals for the three-year period (the Three-Year TSR Tranche) for the 2024 PSUs at the time it granted the 2024 PSUs.
For our 2023 PSUs, the Three-Year TSR Tranche began on May 30, 2023, the grant date for our 2023 PSU awards, and ends on December 31, 2025. The compensation committee established the TSR goals for the 2023 PSUs at the time it granted the 2023 PSUs.
2025 and 2026 Performance Periods. The compensation committee will establish the two financial performance goals for the 2025 and 2026 performance periods at the start of each fiscal year.
For the 2023 PSUs and 2024 PSUs, (x) the goals and for the Three-Year TSR Tranche and (y) the 2024 Adjusted EBITDA Tranche and 2024 Market Share Tranche goals and results are shown below.
|
|
|
|
| Percentage |
| |||||||||
Threshold (25% | Target (100% | Maximum | of Target |
| |||||||||||
Metric | payout) | payout) | (200% payout) | Actual | Achieved |
| |||||||||
2024 PSU - 2024 Adjusted EBITDA Tranche | $ | (93M) | $ | 10M | $ | 113M | $ | (27M) |
| 73 | % | ||||
2023 PSU - 2024 Adjusted EBITDA Tranche | $ | (93M) | $ | 10M | $ | 113M | $ | (27M) |
| 73 | % | ||||
2024 PSU - 2024 Market Share Tranche |
| 0.72 | % |
| 0.81 | % |
| 0.85 | % |
| 0.76 | % | 54 | % | |
2023 PSU - 2024 Market Share Tranche |
| 0.72 | % |
| 0.81 | % |
| 0.85 | % |
| 0.76 | % | 54 | % | |
2024 PSU - Three-year relative TSR percentile |
| 25th |
| 50th |
| 75th |
| n/a |
| n/a |
* For the 2024 PSUs, the number of PSUs earned for the 2024 Adjusted EBITDA Tranche and the 2024 Market Share Tranche, if any, will be “banked” and eligible to vest in early 2027, subject to the executive’s continued service with Redfin.
12
* For the 2023 PSUs, the number of PSUs earned for the 2024 Adjusted EBITDA Tranche and the 2024 Market Share Tranche, if any, will be “banked” and eligible to vest in early 2026, subject to the executive’s continued service with Redfin.
Results of PSUs Granted in May 2022
In 2022, we granted PSUs to our then-serving executives, other than Mr. Kelman, that would be earned based on our performance against three equally weighted performance goals for the period from 2022 through 2024. The performance metrics for these PSUs were net income (loss), market share, and relative TSR as compared to the performance of the S&P 400 MidCap Index. Because the Company did not attain the threshold level of performance for any of the three performance metrics, there was no payout for the 2022 PSUs.
Performance Metric |
| Threshold |
| Actual |
| Payout |
| ||
Gross Profit | $ | 1,793,000 | $ | 1,018,000 | 0 | % | |||
Market Share |
| 1.36 | % | 0.76 | % | 0 | % | ||
Relative TSR |
| 50th |
| <1st Percentile |
| 0 | % | ||
|
| Total Payout | 0 | % |
Other Compensation-Related Practices and Policies
Other Benefits Available to Our NEOs
In addition to the elements of direct compensation described above, our NEOs are also eligible to receive other standard employee benefits. Consistent with our culture of thrift, we do not offer our NEOs any benefit that is unavailable on the same basis to our other full-time employees. The most significant of these benefits include (i) health and life insurance coverage, (ii) a flexible time off policy, (iii) the opportunity to purchase shares of our common stock at a discount pursuant to our 2017 Employee Stock Purchase Plan, (iv) the ability to contribute to a 401(k) retirement plan, including a company match of up to $2,000 on contributions beginning in 2022, and (v) the opportunity to purchase transit and parking using pre-tax dollars.
Agreements with Our NEOs
We do not have an employment agreement with any of our NEOs, but we have entered into employment offer letters with each NEO. Pursuant to these offer letters, each NEO is an “at-will” employee, receives a base salary, has the opportunity to earn an incentive bonus under our executive bonus plan, and is eligible to receive our standard employee benefits.
We have entered into a change in control and severance agreement with each of our NEOs that provides for payments and benefits to the NEO upon a qualifying termination of employment in connection with a change in control. Please see “Potential Payments upon Termination or Change in Control—Change in Control Severance Agreement” below for more information.
13
Share Ownership and Anti-Hedging & Anti-Pledging Policies
We have adopted a share ownership policy that requires each NEO to beneficially own a minimum dollar value of our common stock, or a minimum number of shares, after being an executive officer for four years. Beginning on December 31 of the year in which a director or executive officer has his or her four-year anniversary of becoming a director or executive officer, we require him or her to own a minimum dollar value of our common stock, as described below.
Position |
| Minimum Ownership |
Chief executive officer | 6x base salary or floor of corresponding number of shares based on five-year average closing stock price | |
Non-employee director | 5x board cash retainer or floor of corresponding number of shares based on five-year average closing stock price(1) | |
Executive officer (other than CEO) | 3x base salary or floor of corresponding number of shares based on five-year average closing stock price |
(1) | Excludes retainer for chair or committee service |
To determine whether a director or executive officer meets the ownership threshold, we include shares owned directly and shares underlying unvested time-based RSUs. Shares subject to unvested performance-based stock units, and vested or unvested stock options that have not yet been exercised do not count toward the ownership threshold. We assess whether our directors and executive officers meet our share ownership policy on December 31 of each year. To determine the value of shares beneficially owned, we use (i) the average closing price of our common stock for the 90 trading days preceding and including December 31 and (ii) in the case of shares underlying stock options, the intrinsic value of the options.
If a director or executive officer does not own the minimum dollar value of shares, then he or she must hold at least 50% of the aggregate after-tax shares that have been received (and are still owned), and will be received, upon vesting of restricted stock units or performance stock units or exercise of stock options. However, a director or executive officer will not be required to amend an existing 10b5-1 plan to comply with this retention requirement.
All of the NEOs who have been with the company for at least four years are in compliance with the policy.
We also prohibit the NEOs from purchasing any financial instrument, or otherwise engaging in transactions, that hedge, pledge or offset, or are designed to hedge or offset, any decrease in the value of our common stock that they own. Our directors and executive officers may not pledge Redfin stock as collateral.
We prohibit all employees (including officers) and directors from purchasing any financial instrument, or otherwise engaging in transactions, that hedge or offset, or are designed to hedge or offset, any decrease in the value of Redfin stock owned by the person, regardless of how the person acquired his or her Redfin stock. Specific examples of prohibited instruments include prepaid variable forward contracts, equity swaps, collars, and exchange funds.
For purposes of these anti-pledging and anti-hedging policies, “Redfin stock” includes our publicly traded common stock, our convertible preferred stock, and our convertible senior notes. These policies’ prohibitions extend to (i) people living in the same household as an employee or director and (ii) people or entities whose trading is directed by an employee or director or subject to the employee or director’s influence or control.
Certain Tax and Accounting Impacts of Our NEO Compensation
Under Section 162(m) of the Internal Revenue Code, the company cannot deduct for tax purposes more than one million dollars of compensation for certain executives in a single year. In general, the fact that a significant portion of some executives’ compensation may be non-deductible for tax purposes did not affect the determination of the compensation committee that it was in the best interests of the company and its stockholders to offer its executive officers an appropriately competitive level of compensation.
14
We record compensation expense for the equity awards granted to our NEOs based on the grant date fair value of the awards, and we recognize the expense over the service period for the award. We determine both the grant date fair value and the service period based on accounting standards. To the extent an NEO forfeits an award or we determine that the probable outcome of a PSU award’s performance condition is no longer the same as it was on the grant date, then we will adjust, in the period of the forfeiture or determination, the previously recognized expense.
Compensation Recovery Policy
Our directors adopted and our compensation committee administers, a compensation recovery policy (the “Clawback Policy”) to comply with the rules and regulations promulgated by the SEC, including Rule 10D-1 of the Securities and Exchange Act of 1934, as amended (the “Exchange Act”) that is applicable to our executive officers and all employees who are officers for purposes of Section 16 of the Exchange Act, including current and former executive officers and Section 16 officers (“Covered Employees”). The Clawback Policy allows us to recover or “clawback” incentive-based compensation from Covered Employees in the event of a restatement of our financial statements due to material noncompliance with any financial reporting requirements under the federal securities laws. Under the Clawback Policy, if the restatement would result in any incentive-based compensation paid during the three years preceding the restatement to have been lower had it been calculated based on such restated results, we may recover the amounts in excess of what would have been paid under the restatement from any participant who received such incentive-based compensation. A copy of the Clawback Policy is filed as Exhibit 97.1 to our Original Form 10-K.
Equity Award Grant Practices
Compensation Committee Report
The compensation committee has reviewed and discussed with management the section entitled “Compensation Discussion and Analysis” above. Based on this review and discussion, the compensation committee recommended to Redfin’s board of directors that the “Compensation Discussion and Analysis” section be included in this Form 10-K/A.
James Slavet
Kerry D. Chandler
Selina Tobaccowala
15
Summary Compensation Table
The following table provides information regarding our NEOs’ compensation for 2024, 2023, and 2022.
|
|
|
|
| Non-equity |
| ||||||
Stock | incentive plan | |||||||||||
Name and | Salary(1) | Bonus | awards(2)(3) | compensation(4) | Total | |||||||
principal position | Year | ($) | ($) | ($) | ($) | ($) | ||||||
Glenn Kelman (chief executive officer) |
| 2024 |
| 300,000 |
| — |
| — |
| — |
| 300,000 |
| 2023 |
| 300,000 |
| — |
| — |
| — |
| 300,000 | |
| 2022 |
| 300,000 |
| — |
| — |
| — |
| 300,000 | |
Chris Nielsen (chief financial officer) |
| 2024 |
| 536,058 |
| — |
| 1,448,948 |
| 266,250 |
| 2,251,256 |
| 2023 |
| 500,000 |
| — |
| 1,323,027 |
| 37,500 |
| 1,860,527 | |
| 2022 |
| 500,000 |
| — |
| 1,840,328 |
| 42,000 |
| 2,382,328 | |
Bridget Frey (chief technology officer) |
| 2024 |
| 468,088 |
| — |
| 1,448,948 |
| 207,675 |
| 2,124,711 |
| 2023 |
| 450,000 |
| — |
| 1,323,027 |
| 27,000 |
| 1,800,027 | |
| 2022 |
| 411,538 |
| — |
| 1,552,097 |
| 37,800 |
| 2,001,435 | |
Anthony Kappus (chief of legal affairs and digital revenue officer) |
| 2024 |
| 483,668 |
| — |
| 1,159,156 |
| 203,060 |
| 1,845,884 |
| 2023 |
| 400,000 |
| 60,000 |
| 1,058,413 |
| 26,400 |
| 1,544,813 | |
Christian Taubman (chief growth officer) |
| 2024 |
| 465,532 |
| — |
| 1,516,449 |
| 207,675 |
| 2,189,656 |
(1) In 2024 Redfin switched from an accrual vacation model to an unlimited PTO model for all of our employees. We paid Mr. Nielsen $36,057.70, Ms. Frey $18,087.63, Mr. Kappus $43,667.89 and Mr. Taubman $28,992.56 in connection with this change.
(2) The amounts in this column represent the aggregate grant date fair value of RSU awards and PSU awards computed in accordance with the applicable accounting standards.
For 2023, grant date fair value of the 2023 PSUs include (i) the value of 2023 PSUs allocated to the 2023 Net Income Tranche, which metric was determined on the grant date, and assuming 100% target achievement, (ii) the value of the 2023 PSUs allocated to the 2023 Market Share Tranche, which metric was determined on the grant date, and assuming 100% target achievement and (iii) the value of the 2023 PSUs allocated to the Three-Year TSR Tranche, which metric was determined on the grant date, based on a Monte Carlo simulation. For more information on our 2023 PSUs, see “Compensation Discussion and Analysis—Long-Term Equity Compensation—PSU awards.” Assuming maximum achievement of the 2023 PSU awards’ performance conditions, the grant date fair value of (i) the 2023 PSU awards, but solely for the 2023 Net Income Tranche, 2023 Market Share Tranche and the full Three-Year TSR Tranche, would have been $1,435,546 for Mr. Nielsen, $1,435,546 for Ms. Frey, and $1,148,432 for Mr. Kappus, and (ii) all 2023 RSU awards and PSU awards, in the aggregate, would have been $2,040,800 for Mr. Nielsen, $2,040,800 for Ms. Frey, and $1,632,629 for Mr. Kappus.
For 2024, the grant date fair value includes (i) the value of the 2023 PSUs and of the 2024 PSUs, in both cases allocated to the 2024 Adjusted EBITDA Tranche, which metric was determined on the grant date for the 2024 PSUs and on the same date for the 2023 PSUs, and assuming 100% target achievement, (ii) the value of the 2023 PSUs and of the 2024 PSUs, in both cases allocated to the 2024 Market Share Tranche, which metric was determined on the grant date for the 2024 PSUs and on the same date for the 2023 PSUs, and assuming 100% target achievement and (iii) the value of the 2024 PSUs allocated to the Three-Year TSR Tranche, which metric was determined on the grant date of the 2024 PSUs, based on a Monte Carlo simulation. For more information on our 2024 PSUs, see “Compensation Discussion and Analysis—Long-Term Equity Compensation—PSU awards”.
16
Assuming maximum achievement of the 2024 PSU awards’ performance conditions, the grant date fair value of (i) 2024 PSU awards, but solely for the 2024 Adjusted EBITDA Tranche, 2024 Market Share Tranche and the full Three-Year TSR Tranche, would have been $1,419,608 for Mr. Nielsen and for Ms. Frey, $1,135,679 for Mr. Kappus and $1,526,061 for Mr. Taubman.
Assuming maximum achievement of the 2023 PSU awards’ performance conditions, the grant date fair value of (i) the 2023 PSUs, but solely for the 2024 Adjusted EBITDA Tranche and 2024 Market Share Tranche, would have been $299,382 for Mr. Nielsen and for Ms. Frey, $239,506 for Mr. Kappus and for Mr. Taubman.
(3) As required by the SEC’s rules, the amounts in this column represent the aggregate grant date fair value of equity awards computed in accordance with the applicable accounting standard. These amounts do not correspond to the actual economic value that may be received by our NEOs from the equity awards. Please see Note 11 to our consolidated financial statements included in our Annual Report on Form 10-K for the year ended December 31, 2024 for the assumptions we made in computing the grant date fair value.
(4) The amounts in this column represent the amounts earned under our executive bonus plan for the respective year.
17
Grants of Plan-Based Awards Table
The following table provides information regarding grants of awards to our NEOs, other than Mr. Kelman who did not receive any grants, during 2024 pursuant to our executive bonus plan and, with respect to equity awards, our 2017 Equity Incentive Plan.
|
|
| Estimated possible payout under | Estimated future payouts under |
| All other |
| |||||||||||||
non-equity incentive plan awards(1) | equity incentive plan awards | stock | ||||||||||||||||||
awards: | ||||||||||||||||||||
Number of | Grant date | |||||||||||||||||||
shares of | fair value of | |||||||||||||||||||
stock or | stock | |||||||||||||||||||
Threshold | Target | Maximum | Threshold | Target | Maximum |
| units(4) | awards(5) | ||||||||||||
Name | Type | Grant date | ($) |
| ($) |
| ($) |
| (#) |
| (#) |
| (#) |
| (#) |
| ($) | |||
Chris Nielsen |
| Bonus |
|
|
| — |
| 375,000 |
| 562,500 |
|
|
|
|
|
|
|
|
|
|
RSU |
| 5/28/2024 |
| 95,846 |
| 589,453 | ||||||||||||||
| 2024 PSU |
| 5/28/2024(2) |
| 22,187 |
| 88,748 |
| 177,496 |
| 709,804 | |||||||||
| 2023 PSU |
| 5/28/2024(3) |
| 6,085 |
| 24,340 |
| 48,680 |
| 149,691 | |||||||||
Bridget Frey |
| Bonus |
|
|
| — |
| 292,500 |
| 438,750 |
|
|
|
|
|
|
|
|
|
|
RSU |
| 5/28/2024 |
| 95,846 |
| 589,453 | ||||||||||||||
| 2024 PSU |
| 5/28/2024(2) |
| 22,187 |
| 88,748 |
| 177,496 |
| 709,804 | |||||||||
| 2023 PSU |
| 5/28/2024(3) |
| 6,085 |
| 24,340 |
| 48,680 |
| 149,691 | |||||||||
Anthony Kappus |
| Bonus |
|
|
| — |
| 286,000 |
| 429,000 |
|
|
|
|
|
|
|
|
|
|
RSU |
| 5/28/2024 |
| 76,677 |
| 471,564 | ||||||||||||||
| 2024 PSU |
| 5/28/2024(2) |
| 17,750 |
| 70,998 |
| 141,996 |
| 567,840 | |||||||||
| 2023 PSU |
| 5/28/2024(3) |
| 4,868 |
| 19,472 |
| 38,944 |
| 119,753 | |||||||||
Christian Taubman |
| Bonus |
|
|
| — |
| 292,500 |
| 438,750 |
|
|
|
|
|
|
|
|
|
|
RSU |
| 5/28/2024 |
| 103,035 |
| 633,665 | ||||||||||||||
| 2024 PSU |
| 5/28/2024(2) |
| 23,851 |
| 95,403 |
| 190,806 |
| 763,031 | |||||||||
| 2023 PSU |
| 5/28/2024(3) |
| 4,868 |
| 19,472 | 38,944 |
| 119,753 |
(1)The amounts in this column represent possible payouts under our 2024 executive bonus plan.
(2) The 2024 PSUs were awarded in May 2024 and at that time the performance metrics for the 2024 Adjusted EBITDA Tranche, the 2024 Market Share Tranche and the Three-Year TSR Tranche were approved. The compensation committee will establish the two financial performance goals for the 2025 and 2026 performance periods at the start of each fiscal year (together, the 2025 and 2026 Financial Metric Tranches). Since the 2025 and 2026 Financial Metric Tranches were not established in 2024, the 2025 and 2026 Financial Metric Tranches were not considered granted in 2024 for accounting purposes and are not represented in this table. Amounts in the “Estimated future payouts under equity incentive plan awards” columns represent the range of shares of common stock subject to the 2024 Adjusted EBITDA Tranche, the 2024 Market Share Tranche and the Three-Year TSR Tranche that will become eligible to vest in early 2027 if we meet the designated performance targets, assuming achievement at the threshold, target and maximum performance levels. Vesting is also subject to continued employment, and no shares will be issued if actual performance is below threshold performance levels. For more information regarding the 2024 PSUs, see “Compensation Discussion and Analysis—Long-Term Equity Compensation—PSU awards.”
(3) The 2023 PSUs were awarded in May 2023, however the performance metrics for the 2024 Adjusted EBITDA Tranche and the 2024 Market Share Tranche of the 2023 PSUs were established in May 2024. Upon their establishment, the 2024 Adjusted EBITDA Tranche and the 2024 Market Share Tranche of the 2023 PSUs were considered granted for accounting purposes. Amounts in the “Estimated future payouts under equity incentive plan awards” columns represent the range of shares of common stock subject to the 2024 Adjusted EBITDA Tranche and the 2024 Market Share Tranche of the 2023 PSUs that will become eligible to vest in early 2026 if we meet the designated performance targets, assuming achievement at the threshold, target and maximum performance levels. Vesting is also subject to continued employment, and no shares will be issued if actual performance is below threshold performance levels. For more information regarding the 2023 PSUs, see “Compensation Discussion and Analysis—Long-Term Equity Compensation—PSU awards.”
18
(4) The amounts in this column represent RSU awards.
(5) As required by the SEC’s rules, the amounts in this column represent the aggregate grant date fair value of equity awards computed in accordance with the applicable accounting standards. These amounts do not correspond to the actual economic value that may be received by our NEOs from the equity awards.
Option Exercises and Stock Vested Table
The following table provides information regarding exercises of stock options and vesting of RSU awards during 2024.
| Option awards |
| Stock awards | |||||
| Number of shares |
| Value realized on |
| Number of shares |
| Value realized on | |
acquired on exercise | exercise(1) | acquired on vesting | vesting(1) | |||||
Name | (#) | ($) | (#) | ($) | ||||
Glenn Kelman | — | — | — | — | ||||
Chris Nielsen | — | — | 83,819 | 669,716 | ||||
Bridget Frey | 12,316 | 37,739 | 80,656 | 644,915 | ||||
Anthony Kappus | — | — | 64,737 | 517,977 | ||||
Christian Taubman | — | — | 71,042 | 571,963 |
(1) As required by the SEC’s rules, the value realized (i) with respect to exercise of stock options, is based on the difference between the closing price of our common stock on the day of exercise and the exercise price of the option award and (ii) with respect to vesting of RSU awards, is based on the closing price of our common stock on the vesting date. These amounts do not correspond to the actual economic value that was received by our NEOs from such exercise or vesting.
Potential Payments upon Termination or Change in Control
Change in Control Severance Agreement
Each NEO has a change in control severance agreement, or change in control agreement, with us. The change in control agreement provides that the NEO will receive the payments and benefits described below upon either (i) a termination by us of the NEO’s employment without “cause” or (ii) a voluntary resignation by the NEO from his or her employment with “good reason,” in each case during the period three months before a “change in control” and ending 12 months after a “change in control” of our company. The change in control agreement defines the terms “cause,” “good reason,” and “change in control.” We refer to either of these terminations of employment as a “qualifying termination.” The payments and benefits provided by the change in control agreement are contingent upon the consummation of the change in control of our company and the NEO executing a release of claims in favor of our company. Each change in control severance agreement automatically renews following its initial three-year term.
In the event of qualifying termination, the NEO will be entitled to: (i) a lump sum payment equal to six months of base salary, (ii) a lump sum payment equal to six months of costs to continue health insurance coverage under COBRA, and (iii) have then-outstanding and unvested non-performance-based stock option and RSU awards accelerate and become vested as if the NEO had continued in service for an additional 24 months. Each NEO’s PSU awards that are deemed earned upon a change in control, as described below, are eligible for acceleration and vesting to the same extent as non-performance-based RSU awards.
If a change in control occurs and our successor or acquirer refuses to assume, convert, or substitute the then-outstanding and unvested non-performance-based RSU awards held by the NEO, then those awards will accelerate in full.
19
PSU Award Agreements
Under the award agreement for our PSU awards, if a change in control (as defined in the applicable award agreement) occurs and the NEO is providing service to us through the change in control, then the award’s financial performance metrics for annual performance periods that have not yet concluded will be deemed achieved at 100% of target and the award’s relative TSR metric will be determined by our board, or a board committee, as constituted immediately prior to the change in control.
The resulting number of earned awards will then become subject to time-based vesting, and the NEO will vest 100% of these earned awards as of the end of the three-year performance period originally applicable to the award. To the extent earned but unvested at the time of a change in control, these earned awards are eligible for acceleration and vesting pursuant to the NEO’s change in control agreement, as described above.
If, however, a successor entity does not assume, convert, replace, or substitute the resulting number of earned awards, then these earned awards will accelerate and become vested immediately prior to the consummation of the change in control.
2017 Equity Incentive Plan
Our 2017 Equity Incentive Plan (the “2017 plan”), governs all of our NEOs’ equity awards. Pursuant to our 2017 plan, if, upon a change in control (defined as a “corporate transaction” in our 2017 plan), a successor entity does not assume, convert, replace, or substitute outstanding equity award, then the award will accelerate and become vested immediately prior to the consummation of the change in control.
20
Estimated Value of Payments and Benefits
The table below provides the estimated value of the payments and benefits that would have been received by our NEOs in the following scenarios:
● | a change in control of our company occurred on December 31, 2024 and the successor entity assumed, converted, or substituted the NEO’s equity awards; |
● | a change in control of our company occurred on December 31, 2024 and the successor entity did not assume, convert, or substitute the NEO’s equity awards; |
● | a change in control of our company occurred on December 31, 2024, the successor entity assumed, converted, or substituted the NEO’s equity awards, and each NEO had a qualifying termination on December 31, 2024 immediately following the change in control; and |
● | a change in control of our company occurred on December 31, 2024, the successor entity did not assume, convert, or substitute the NEO’s equity awards, and each NEO had a qualifying termination on December 31, 2024 immediately following the change in control. |
|
| Payment for |
| Value from |
| Value from |
| |||
continued | acceleration | acceleration | ||||||||
health | of unvested | of unearned | ||||||||
Cash | insurance | RSU | PSU | |||||||
severance | coverage | awards(1) | awards(1) | Total | ||||||
Name | ($) | ($) | ($) | ($) | ($) | |||||
Glenn Kelman | ||||||||||
Change in control and successor assumed equity awards |
| — |
| — |
| — |
| — |
| — |
Change in control and successor did not assume equity awards(2) |
| — |
| — |
| — |
| — |
| — |
Change in control, successor assumed equity awards, and qualifying termination(3) |
| 150,000 |
| 5,906 |
| — |
| — |
| 155,906 |
Change in control, successor did not assume equity awards, and qualifying termination(2) |
| 150,000 |
| 5,906 |
| — |
| — |
| 155,906 |
Chris Nielsen |
|
|
|
|
|
|
|
|
|
|
Change in control and successor assumed equity awards |
| — |
| — |
| — |
| — |
| — |
Change in control and successor did not assume equity awards(2) |
| — |
| — |
| 758,471 |
| 1,863,964 |
| 2,622,435 |
Change in control, successor assumed equity awards, and qualifying termination(3) |
| 250,000 |
| 18,155 |
| 758,471 |
| 1,863,964 |
| 2,890,590 |
Change in control, successor did not assume equity awards, and qualifying termination(2) |
| 250,000 |
| 18,155 |
| 758,471 |
| 1,863,964 |
| 2,890,590 |
Bridget Frey |
|
|
|
|
|
|
|
|
|
|
Change in control and successor assumed equity awards |
| — |
| — |
| — |
| — |
| — |
Change in control and successor did not assume equity awards(2) |
| — |
| — |
| 724,788 |
| 1,863,962 |
| 2,588,750 |
Change in control, successor assumed equity awards, and qualifying termination(3) |
| 225,000 |
| 11,346 |
| 724,788 |
| 1,863,962 |
| 2,825,096 |
Change in control, successor did not assume equity awards, and qualifying termination(2) |
| 225,000 |
| 11,346 |
| 724,788 |
| 1,863,962 |
| 2,825,096 |
Anthony Kappus |
|
|
|
|
|
|
|
|
|
|
Change in control and successor assumed equity awards |
| — |
| — |
| — |
| — |
| — |
Change in control and successor did not assume equity awards(2) |
| — |
| — |
| 589,597 |
| 1,491,164 |
| 2,080,761 |
Change in control, successor assumed equity awards, and qualifying termination(3) |
| 220,000 |
| 18,155 |
| 589,597 |
| 1,491,164 |
| 2,318,916 |
Change in control, successor did not assume equity awards, and qualifying termination(2) |
| 220,000 |
| 18,155 |
| 589,597 |
| 1,491,164 |
| 2,318,916 |
Christian Taubman |
|
|
|
|
|
|
|
|
|
|
Change in control and successor assumed equity awards |
| — |
| — |
| — |
| — |
| — |
Change in control and successor did not assume equity awards(2) |
| — |
| — |
| 714,242 |
| 1,808,853 |
| 2,523,095 |
Change in control, successor assumed equity awards, and qualifying termination(3) |
| 225,000 |
| 16,754 |
| 714,242 |
| 1,808,853 |
| 2,764,849 |
Change in control, successor did not assume equity awards, and qualifying termination(2) |
| 225,000 |
| 16,754 |
| 714,242 |
| 1,808,853 |
| 2,764,849 |
(1) This value is based on the closing price of our common stock on December 31, 2024, the last trading day of the year.
(2) This scenario assumes (i) acceleration of all unvested RSU awards, (ii) the performance condition(s) of each NEO’s PSU award(s) for annual performance periods that have not yet concluded were deemed earned at 100% of target as of the end of the performance period applicable to such awards, (iii) the performance condition(s) of each NEO’s PSU awards for annual performance periods that have concluded were achieved at actual level of achievement as detailed below, and (iv) accelerated vesting of all of the resulting number of earned awards. For the portion of PSUs that were granted in 2023, whose performance period ended on December 31, 2023, 113% attainment was used for the 2023 Net Income goal and 0% was used for 2023 Market share gain goal. For the portion of PSUs that were granted in 2023,
21
whose performance period ended on December 31, 2024, 73% attainment was used for the 2024 Adjusted EBITDA goal and 54% was used for 2024 Market share gain goal. For the portion of PSUs that were granted in 2024, whose performance period ended on December 31, 2024, 73% attainment was used for the 2024 Adjusted EBITDA goal and 54% was used for 2024 Market share gain goal. For the portion of the PSUs granted in 2023 and 2024, an estimated 100% achievement was used for the relative TSR goal.
(3) This scenario assumes (i) acceleration of unvested RSU awards scheduled to vest by December 31, 2026, (ii) the performance condition(s) each NEO’s PSU award(s) for annual performance periods that have not yet concluded were deemed earned at 100% of target as of the end of the performance period applicable to such awards, (iii) the performance condition(s) of each NEO’s PSU awards for annual performance periods that have concluded were achieved at actual level of achievement as detailed below and (iv) accelerated vesting of the resulting number of earned awards whose performance period ends on or before December 31, 2026. For the portion of PSUs that were granted in 2023, whose performance period ended on December 31, 2023, 113% attainment was used for the 2023 Net Income goal and 0% was used for 2023 Market share gain goal. For the portion of PSUs that were granted in 2023, whose performance period ended on December 31, 2024, 73% attainment was used for the 2024 Adjusted EBITDA goal and 54% was used for 2024 Market share gain goal. For the portion of PSUs that were granted in 2024, whose performance period ended on December 31, 2024, 73% attainment was used for the 2024 Adjusted EBITDA goal and 54% was used for 2024 Market share gain goal. For the portion of the PSUs granted in 2023 and 2024, an estimated 100% achievement was used for the relative TSR goal.
22
CEO PAY RATIO
The ratio of the 2024 total compensation of (i) our chief executive officer, as reported in the Summary Compensation Table, to (ii) our median employee, as computed in the same manner, is 3:1 based on the amounts of $300,000 to $92,297, respectively.
We selected our median employee from our employee population on the last day of our last payroll period for 2024, which was December 14. We refer to this as the determination date. On the determination date, we had 4,934 employees, which excludes (i) our chief executive officer and (ii) 11 employees who we employed in Canada. Canada was the only country outside of the United States where we employed people on the determination date, and our Canadian employees accounted for less than five percent of our total employees on such date.
We identified our median employee by aggregating the dollar amounts of the following compensation types for each employee on the determination date. We aggregated the amounts included in our employees’ first paycheck of 2024 through their last paycheck of 2024.
● | Base salary. |
● | Overtime pay. |
● | Cash bonuses and payments based on events or transactions. These include payments for taking customers on tours and representing a homebuyer or home seller in closing a home purchase or sale, respectively. These exclude any bonuses that generally cannot be earned more than once by the same employee, such as a starting or relocation bonus. |
● | Value of vested restricted stock units, as calculated by the number of vested restricted stock units multiplied by our closing stock price on the vesting date. |
PAY VERSUS PERFORMANCE
As required by Section 953(a) of the Dodd-Frank Wall Street Reform and Consumer Protection Act and Item 402(v) of Regulation S-K, we are providing the following disclosure regarding executive compensation for our CEO and other NEOs, our total shareholder return and that of our selected peer group, our net income and the most important “financial performance measure” used by us to link executive pay with Company performance. This table and the accompanying disclosures are prescribed by SEC rules. Those rules require amounts included in the “compensation actually paid” columns of the table to be calculated according to a particular formula, which reflects a number of fair value adjustments to equity awards intended to show the change in value of those awards from one year to another. They do not reflect, however, the precise amounts actually earned by or paid to our executives during the years shown in the table.
For further information concerning our pay-for-performance philosophy and how we structure our executive compensation to drive and reward performance, refer to “Executive Compensation—Compensation Discussion and Analysis.”
Value of Initial Fixed $100 | ||||||||||||||||||||||||
Investment Based On: | ||||||||||||||||||||||||
Average | ||||||||||||||||||||||||
Summary | Average | |||||||||||||||||||||||
Summary | Compensation | Compensation | Peer Group | |||||||||||||||||||||
Compensation | Compensation | Table Total | Actually Paid to | Total | Total | Net | ||||||||||||||||||
Fiscal | Table Total | Actually | for non-PEO | non-PEO | Shareholder | Shareholder | Income | Adjusted | ||||||||||||||||
Year(1) |
| for PEO(2) |
| Paid to PEO(2) |
| NEOs(2) |
| NEOs(2) |
| Return(3) |
| Return(4) |
| ($M)(5) |
| EBITDA(6) | ||||||||
2024 | $ | | $ | | $ | | $ | |
| $ | |
| $ | |
| $ | ( | $ | ( | |||||
2023 | $ | | $ | | $ | | $ | | $ | | $ | | $ | ( | $ | ( | ||||||||
2022 | $ | | $ | ( | $ | | $ | ( | $ | | $ | | $ | ( | $ | ( | ||||||||
2021 | $ | | $ | ( | $ | | $ | ( | $ | | $ | | $ | ( | $ | | ||||||||
2020 | $ | | $ | | $ | | $ | | $ | | $ | | $ | ( | $ | |
(1)
23
● | 2024: Christopher Nielsen, Bridget Frey, Anthony Kappus, Christian Taubman. |
● | 2023: Christopher Nielsen, Bridget Frey, Adam Wiener, Anna Stevens, Anthony Kappus. |
● | 2022: Christopher Nielsen, Bridget Frey, Adam Wiener, Anna Stevens. |
● | 2021: Christopher Nielsen, Bridget Frey, Adam Wiener, Ee Lyn Khoo. |
● | 2020: Christopher Nielsen, Bridget Frey, Adam Wiener, Scott Nagel. |
(2) The Summary Compensation Table (“SCT”) totals reported for the CEO and the average of the other NEOs for 2024 were subject to the adjustments summarized in the two tables below as required by Regulation S-K Item 402(v)(2)(iii) to calculate “compensation actually paid.” Equity values are calculated in accordance with FASB ASC Topic 718. Valuation assumptions used to calculate fair values at the times indicated in the two tables below did not materially differ from those disclosed at the time of grant except for the stock price, percentage of volatility, risk free rate and the term used to calculate the valuations.
PEO |
| ||
Prior FYE |
| 12/31/2023 | |
Current FYE |
| 12/31/2024 | |
Fiscal Year |
| 2024 | |
SCT Total | $ | | |
- Grant Date Fair Value of Option Awards and Stock Awards Granted in Fiscal Year as reported in SCT | $ | | |
+ Fair Value at Fiscal Year-End of Outstanding and Unvested Option Awards and Stock Awards Granted in Fiscal Year | $ | | |
+ Change in Fair Value of Outstanding and Unvested Option Awards and Stock Awards Granted in Prior Fiscal Years | $ | | |
+ Fair Value at Vesting of Option Awards and Stock Awards Granted in Fiscal Year That Vested During Fiscal Year | $ | | |
+ Change in Fair Value as of Vesting Date of Option Awards and Stock Awards Granted in Prior Fiscal Years For Which Applicable Vesting Conditions Were Satisfied During Fiscal Year | $ | | |
- Fair Value as of Prior Fiscal Year-End of Option Awards and Stock Awards Granted in Prior Fiscal Years That Failed to Meet Applicable Vesting Conditions During Fiscal Year | $ | | |
Compensation Actually Paid | $ | |
Non-PEO NEOs |
|
| |
Prior FYE |
| 12/31/2023 | |
Current FYE |
| 12/31/2024 | |
Fiscal Year |
| 2024 | |
SCT Total | $ | | |
- Grant Date Fair Value of Option Awards and Stock Awards Granted in Fiscal Year as reported in SCT | $ | ( | |
+ Fair Value at Fiscal Year-End of Outstanding and Unvested Option Awards and Stock Awards Granted in Fiscal Year | $ | | |
+ Change in Fair Value of Outstanding and Unvested Option Awards and Stock Awards Granted in Prior Fiscal Years | $ | ( | |
+ Fair Value at Vesting of Option Awards and Stock Awards Granted in Fiscal Year That Vested During Fiscal Year | $ | | |
+ Change in Fair Value as of Vesting Date of Option Awards and Stock Awards Granted in Prior Fiscal Years For Which Applicable Vesting Conditions Were Satisfied During Fiscal Year | $ | ( | |
- Fair Value as of Prior Fiscal Year-End of Option Awards and Stock Awards Granted in Prior Fiscal Years That Failed to Meet Applicable Vesting Conditions During Fiscal Year | $ | | |
Compensation Actually Paid | $ | |
(3) Represents the total shareholder return (“TSR”) of a $100 investment in the Company’s shares as of December 31, 2019, valued again on each of December 31, 2020, 2021, 2022, 2023 and 2024.
(4) Represents the TSR of the RDG Composite Index based on a $100 investment as of December 31, 2019, valued again on each of December 31, 2020, 2021, 2022, 2023 and 2024.
24
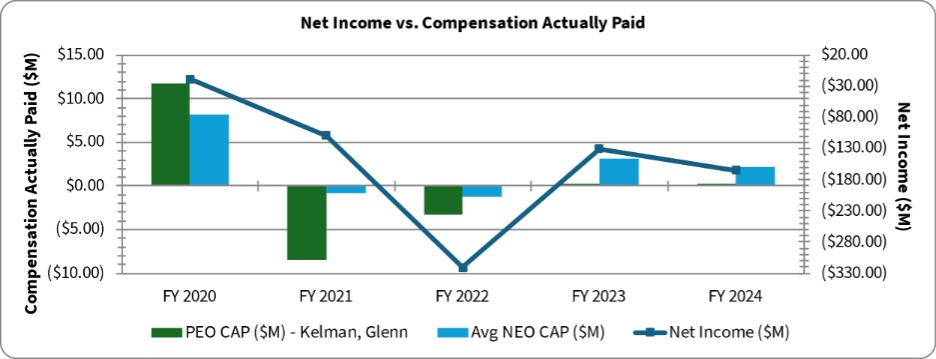
(5) Net income as reported in the Company’s audited financial statements.
(6) We determined Adjusted EBITDA to be the most important financial performance measure used to link Company performance to Compensation Actually Paid to our PEO and Non-PEO NEOs in 2024. Adjusted EBITDA is a non-GAAP financial measure. Please see “Segment Financial Information” in our Annual Report on Form 10-K for more information on Adjusted EBITDA, including a reconciliation to Net Loss. Adjusted EBITDA for 2024, 2023, 2022 and 2021 are all continuing operations due to the wind-down of RedfinNow. Adjusted EBITDA for 2020 is consolidated and includes RedfinNow, since we did not distinguish between continuing and discontinuing operations. We may determine a different financial performance measure to be the most important financial performance measure in future years.
Analysis of the Information Presented in the Pay Versus Performance Table
In this section, we provide a graphic analysis showing a comparison of the compensation actually paid to executives and total shareholder return, net income and Adjusted EBITDA. The “compensation actually paid” is calculated in accordance with the methodology described above.
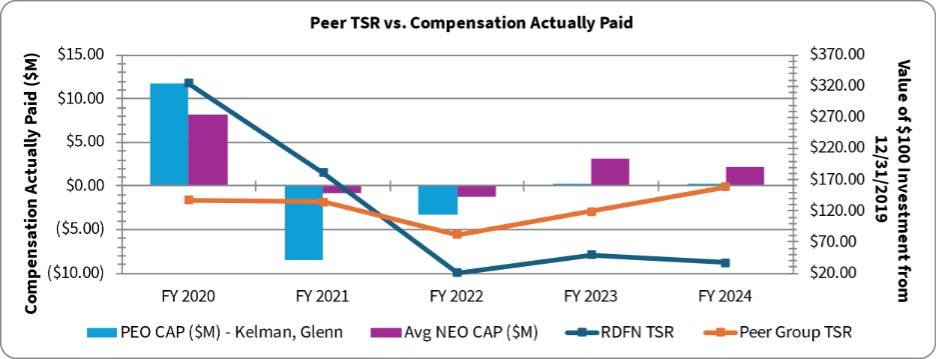
Description of Relationship Between PEO and Non-PEO NEO Compensation Actually Paid and Company Total Shareholder Return (“TSR”) and Peer Group TSR
The following chart sets forth the relationship between compensation actually paid to our PEO, the average of compensation actually paid to our Non-PEO NEOs, and the Company’s cumulative TSR and the RDG Composite Index cumulative TSR over the five most recently completed fiscal years.
25
Description of Relationship Between PEO and Non-PEO NEO Compensation Actually Paid and Net Income
The following chart sets forth the relationship between compensation actually paid to our PEO, the average of compensation actually paid to our Non-PEO NEOs, and our net income during the five most recently completed fiscal years.
Description of Relationship Between PEO and Non-PEO NEO Compensation Actually Paid and Adjusted EBITDA
The following chart sets forth the relationship between compensation actually paid to our PEO, the average of compensation actually paid to our Non-PEO NEOs, and our Adjusted EBITDA during the five most recently completed fiscal years.
Tabular List of Most Important Financial and Non-Financial Performance Measures
The following table presents the financial and non-financial performance measure that the company considers to have been the most important in linking Compensation Actually Paid to our PEO and non-PEO NEOs for 2024 to company performance. The measures in this table are not ranked.
26
Director Compensation
Our board of directors establishes our directors’ compensation based on the recommendation of our compensation committee. The committee annually reviews the amount and form of our directors’ compensation, including evaluating data and analysis regarding market levels of compensation provided by Compensia, a national executive compensation consultant, and recommends any adjustments based on that review.
We compensate our non-employee directors with a combination of cash and equity, in the form of restricted stock unit, or RSU, awards. Glenn Kelman, our chief executive officer, also serves as a director. We compensate Mr. Kelman solely for serving as our chief executive officer—see “Executive Compensation” above—and do not provide additional compensation for his service as a director.
In March 2024, following our compensation committee’s annual review of director compensation and upon the committee’s recommendation after reviewing market data provided by Compensia, cash compensation fees and the annual RSU award for our non-employee directors remained unchanged from 2023.
The table below describes our cash compensation arrangements with our non-employee directors.
Fee type |
| 2024 | |
Board chair fee(1) | $ | 85,000 | |
Board member fee |
| 55,000 | |
Committee chair fee(1) |
|
| |
Audit committee |
| 30,000 | |
Compensation committee |
| 20,000 | |
Nominating and corporate governance committee |
| 10,000 | |
Committee member fee |
|
| |
Audit committee |
| 15,000 | |
Compensation committee |
| 7,500 | |
Nominating and corporate governance committee |
| 5,000 |
(1) The board chair and each committee chair receives only the fee due to him or her as chair and does not receive an additional fee as a member of our board or a committee, respectively.
Immediately following our annual meeting in June 2024, we granted each of our then non-employee directors, excluding David Lissy, our board chair, a $165,000 RSU award. We granted Mr. Lissy a $190,000 RSU award. We computed the number of RSUs granted by dividing the dollar value of the RSU award by the average closing price of our common stock for the 30 trading days prior to the date of our 2024 annual meeting. These awards vest on June 9, 2025, so long as the non-employee director continues to provide services to us through such date. Our non-employee directors can defer settlement of their annual RSU award to the sixtieth day following the day that they are no longer providing services to us or, if earlier, following a change in control transaction.
The following table provides information regarding the compensation earned by our non-employee directors in 2024.
| 2024 Fees earned or |
| Stock |
| Option |
| ||
paid in cash | awards(1)(2)(3) | awards(3) | Total | |||||
Name | ($) | ($) | ($) | ($) | ||||
Robert Bass |
| 90,000 |
| 172,876 |
| — |
| 262,876 |
Julie Bornstein |
| 65,000 |
| 172,876 |
| — |
| 237,876 |
Kerry D. Chandler |
| 62,500 |
| 172,876 |
| — |
| 235,376 |
Austin Ligon |
| 70,000 |
| 172,876 |
| — |
| 242,876 |
David Lissy |
| 85,000 |
| 172,876 |
| — |
| 284,070 |
Brad Singer |
| 70,000 |
| 172,876 |
| — |
| 242,876 |
James Slavet |
| 75,000 |
| 172,876 |
| — |
| 247,876 |
Selina Tobaccowala |
| 62,500 |
| 172,876 |
| — |
| 235,376 |
27
(1) As required by the SEC’s rules, the amounts in this column represent the grant date fair value of the non-employee director’s 2024 RSU award computed in accordance with the applicable accounting standard. These amounts do not correspond to the actual economic value that may be received by our directors from the RSU awards. Please see Note 11 to our consolidated financial statements included in the Original Form 10-K for the assumptions we made in computing the grant date fair value.
(2) Mr. Lissy and Mr. Ligon have deferred settlement of their 2024 RSU award to the sixtieth day following the day that they are no longer providing services to us or, if earlier, following a change in control transaction.
(3) The table below reports the number of RSU and stock option awards held by each non-employee director as of December 31, 2024. RSU awards that have vested, but whose settlement into shares have been deferred, are reported separately.
|
| Vested RSUs |
| |||
awards with | ||||||
RSU | deferred | Stock option | ||||
Name | awards | settlement | awards | |||
Robert Bass |
| 25,423 |
| — |
| 66,666 |
Julie Bornstein |
| 25,423 |
| — |
| 20,000 |
Kerry D. Chandler |
| 25,423 |
| — |
| — |
Austin Ligon |
| 25,423 |
| 26,062 |
| 37,567 |
David Lissy |
| 29,275 |
| 44,795 |
| — |
Brad Singer |
| 25,423 |
| 16,819 |
| — |
James Slavet |
| 25,423 |
| 3,767 |
| — |
Selina Tobaccowala |
| 25,423 |
| — |
| — |
28
Item 12. Security Ownership of Certain Beneficial Owners and Management and Related Stockholder Matters
SECURITY OWNERSHIP OF CERTAIN BENEFICIAL OWNERS AND MANAGEMENT
The table below provides information regarding the beneficial ownership of our common stock as of April 14, 2025 by:
● | each person known to us to be the beneficial owner of more than 5% of our common stock and |
● | our management, which includes: |
o | each of our directors; |
o | each of our named executive officers, as described in “Executive Compensation” above; and |
o | all of our directors and executive officers as a group. |
We computed the number of shares beneficially owned and the percentage of our common stock represented by that ownership based on the SEC’s rules. Accordingly, ownership reflects shares over which a person has voting or investment power and includes shares that a person has the right to acquire by June 13, 2025. Except as indicated in the footnotes to the table, each person has sole voting and investment power over the shares reported as beneficially owned by the person.
| Number of shares |
|
| ||
beneficially |
| ||||
Name of beneficial owner |
| owned | Percent of class | ||
>5% beneficial owners | |||||
Bares Capital Management, Inc. |
| 8,719,526 | (1) | 6.8 | % |
BlackRock, Inc. |
| 9,720,089 | (2) | 7.6 | % |
The Vanguard Group |
| 16,827,798 | (3) | 13.1 | % |
Management |
|
| * | ||
Jason Aleem |
| 126,771 | (4) | * | |
Robert Bass |
| 133,824 | (5) | * | |
Julie Bornstein |
| 88,642 | (6) | * | |
Kerry D. Chandler |
| 59,399 | (7) | * | |
Bridget Frey |
| 659,042 | (8) | * | |
Anthony Kappus |
| 81,585 | (9) | * | |
Glenn Kelman |
| 2,261,272 | (10) | 1.8 | % |
Austin Ligon |
| 693,002 | (11) | * | |
David Lissy |
| 69,835 | (12) | * | |
Chris Nielsen |
| 762,248 | (13) | * | |
Brad Singer |
| 91,578 | (14) | * | |
James Slavet |
| 267,364 | (15) | * | |
Anna Stevens |
| 64,158 | (16) | * | |
Christian Taubman |
| 98,519 | (17) | * | |
Selina Tobaccowala |
| 156,320 | (18) | * | |
All directors and executive officers as a group (15 individuals) |
| 5,613,559 | (19) | 4.3 | % |
* | Percentage owned does not exceed one percent. |
(1) Bares Capital Management, Inc. and Brian Bares have shared voting power and shared investment power over 7,678,676 shares, and Brian Bares has sole voting and sole investment power over 1,040,850 shares. The address for Bares Capital Management, Inc. is 12600 Hill Country Blvd, Suite R-230, Austin, TX 78738. All information relating to Bares Capital Management, Inc. is based on the Schedule 13G it filed on December 11, 2023.
(2) Of the shares beneficially owned, BlackRock, Inc. has sole voting power over 9,517,191 shares and sole investment power over 9,720,089 shares. The address for BlackRock, Inc. is 50 Hudson Yards, New York, NY 10001. All information relating to BlackRock, Inc. is based on the Schedule 13G it filed on January 25, 2024.
29
(3) Of the shares beneficially owned, The Vanguard Group has shared voting power over 208,237 shares, sole investment power over 16,928,530 shares, and shared investment power over 309,777 shares. The address for The Vanguard Group is 100 Vanguard Blvd., Malvern, PA 19355. All information relating to The Vanguard Group is based on the Schedule 13G it filed on January 31, 2025.
(4) Ownership includes 17,202 shares underlying restricted stock units.
(5) Ownership includes 66,666 shares underlying stock options and 25,423 shares underlying restricted stock units.
(6) Ownership includes 20,000 shares underlying stock options and 25,423 shares underlying restricted stock units.
(7) Ownership includes 25,423 shares underlying restricted stock units.
(8) Ownership includes 167,781 shares underlying stock options and 25,665 shares underlying restricted stock units.
(9) Ownership includes 38,143 shares underlying stock options and 20,715 shares underlying restricted stock units.
(10) Ownership includes 802,824 underlying stock options.
(11) Ownership includes 37,567 shares underlying stock options. Excludes 51,485 shares underlying restricted stock units that have vested and for which Mr. Ligon has deferred settlement.
(12) Of the shares beneficially owned, an aggregate of 50,000 shares are held by four separate trusts. Excludes 74,070 shares underlying restricted stock units that have vested and for which Mr. Lissy has deferred settlement.
(13) Ownership includes 249,999 shares underlying stock options and 26,508 shares underlying restricted stock units.
(14) Of the shares beneficially owned, 50,000 shares are held by a trust. Excludes 16,819 shares underlying restricted stock units that have vested and for which Mr. Singer has deferred settlement.
(15) Ownership includes 16,819 shares underlying restricted stock units. Excludes 29,190 shares underlying restricted stock units that have vested and for which Mr. Slavet has deferred settlement.
(16) Ownership includes 19,911 shares underlying restricted stock units.
(17) Ownership includes 23,903 shares underlying restricted stock units.
(18) Ownership includes 25,423 shares underlying restricted stock units.
(19) Ownership includes 1,382,980 shares underlying stock options and 261,019 shares underlying restricted stock units. Excludes 91,443 shares underlying restricted stock units that have vested and 80,121 shares underlying restricted stock units that are scheduled to vest on June 9, 2025 for which certain directors have deferred settlement in each case.
30
EQUITY COMPENSATION PLAN INFORMATION
The table below presents information as of December 31, 2024 relating to compensation plans under which we may issue shares of our common stock.
| Number of shares to be |
| Weighted- |
| Number of shares remaining |
| ||
issued upon exercise of | average exercise | available for future issuance |
| |||||
outstanding options and | price of | under equity compensation |
| |||||
settlement of outstanding | outstanding | plans (excluding securities |
| |||||
restricted stock units | options | reflected in column (a)) |
| |||||
Plan category | (a) | (b) | (c) |
| ||||
Equity compensation plans approved by stockholders(1) |
| 18,301,789 | (2) | $ | 11.60 | (2) | 11,896,383 | (3)(4) |
Equity compensation plans not approved by stockholders |
| — |
| — |
| — | ||
Total |
| 18,301,789 | (2) | $ | 11.60 | (2) | 11,896,383 | (3)(4) |
(1) This category consists of our Amended and Restated 2004 Equity Incentive Plan, or 2004 plan, our 2017 plan, and our 2017 Employee Stock Purchase Plan, or ESPP.
(2) Consists of (i) 2,023,675 shares issuable upon exercise of stock options that are not subject to performance conditions, including stock options for which performance-conditions have previously been achieved, (ii) 11,309,998 shares issuable upon settlement of restricted stock units that are not subject to performance conditions, and (iii) 4,968,116 shares issuable upon settlement of performance-based restricted stock units, which represents the maximum payment under the performance-based restricted stock units. The weighted-average exercise price in column (b) does not take these restricted stock units and performance-based restricted stock units into account.
(3) Consists of 8,252,747 shares of common stock that remain available for issuance under our 2017 plan and 3,643,636 shares that remain available for issuance under our ESPP. There are no shares of common stock available for issuance under our 2004 plan, but the plan continues to govern the terms of stock option awards granted under the plan. Any shares of common stock that are subject to outstanding awards granted under our 2004 plan and that are forfeited will generally be added to, and become available for issuance under, our 2017 plan.
(4) Our 2017 plan and our ESPP each provides for an automatic annual increase in the number of shares available for issuance under the plan. Any increase will occur on the first day of each year, beginning on January 1, 2018 and continuing through January 1, 2028. For our 2017 plan, the amount of any increase is equal to the lesser of 5% of our outstanding shares of common stock as of the immediately preceding December 31 or an amount determined by our board of directors. For our ESPP, the amount of any increase is equal to the lesser of 1% of our outstanding shares of common stock as of the immediately preceding December 31 or an amount determined by our board of directors.
31
Item 13. Certain Relationships and Related Transactions, and Director Independence
Director Independence
We evaluated the independence of our directors based on the listing standards of The Nasdaq Stock Market, which is where our common stock is listed, and concluded that each director, other than Glenn Kelman, is independent.
Related Party Matters
Related Party Transactions Policy
Our board of directors has adopted a written related party transactions policy. Under this policy, we consider each of the following people to be a “related party”: director; director nominee; executive officer; and person who beneficially owns more than five percent of our common stock. Our policy requires each related party to notify us of any transaction in which Redfin or any of its subsidiaries participates and that involves (i) the related party, (ii) the related party’s immediate family member, (iii) the related party’s household member, or (iv) an entity from which the related party or any person covered by clauses (ii) or (iii) may derive an economic benefit. We refer to any such transaction as a “reportable transaction,” and we refer to the persons covered by clauses (i) through (iii) of the foregoing sentence as “covered persons.”
Our policy directs our chief legal officer to evaluate each reportable transaction to determine if a covered person will have a direct or indirect material interest in the transaction. In making this evaluation, our general counsel will consider all facts and circumstances regarding the transaction. Our board of directors has concluded that a covered person will not have a direct or indirect material interest in any of the following transactions if he or she receives the same terms as an unrelated third party would have received for the transaction, other than any discount the covered person receives that is also available to our full-time employees or independent contractor licensed sales professionals generally and on a non-discriminatory basis:
● | Sell a home using Redfin as the listing agent |
● | Purchase a home using Redfin as the buyer’s agent |
● | Purchase a home using the Redfin Direct offer tool |
● | Obtain title insurance or escrow or settlement services through Title Forward, which is our title and settlement subsidiary |
If our chief legal officer determines that a covered person has a direct or indirect material interest in a reportable transaction, then he or she will refer the transaction to our nominating and corporate governance committee and ask the committee to review, and if appropriate, approve or ratify the transaction. We refer to any reportable transaction that has been referred to the committee as a “related party transaction.”
In deciding whether to approve a related party transaction, our nominating and corporate governance committee will review all facts and circumstances regarding the transaction, including the factors listed below.
● | Any conflict of interest, or the appearance of a conflict of interest, of the transaction to us |
● | The transaction’s impact on a director’s independence under all applicable legal standards |
● | If the transaction involves the provision of products or services to us, the availability of comparable products or services from unrelated third parties |
● | Whether the terms of the transaction are substantially comparable to terms between Redfin and an unrelated third party or employee generally |
32
Our chief legal officer may, at his or her discretion, notify our nominating and corporate governance committee of a reportable transaction that does not constitute a related party transaction in order to keep the committee apprised of a related party’s transactions in which we participate. Additionally, our general counsel will also refer a related party transaction to our disclosure committee to evaluate whether we should disclose the transaction in a filing with the SEC. If a reportable transaction involves our general counsel, then our chief financial officer will assume the general counsel’s role for purposes of our policy. If a related party transaction involves a member of our nominating and corporate governance committee, then our entire board of directors or another committee, in each case excluding the conflicted director, will evaluate the transaction.
Related Party Transactions
None.
33
Item 14. Principal Accounting Fees and Services
The following table presents the aggregate fees billed by Deloitte for 2024 and 2023.
| 2024 |
| 2023 | |||
Audit fees(1) | $ | 3,730,000 | $ | 4,185,000 | ||
Audit-related fees(2) |
| — |
| — | ||
Tax fees |
| — |
| — | ||
All other fees(3) |
| 8,148 |
| 8,148 | ||
Total | $ | 3,738,148 | $ | 4,193,148 |
(1) Audit fees relate to professional services rendered by Deloitte for the audit of our consolidated financial statements, review of interim consolidated financial statements included in our quarterly reports, and for the audit of our internal control over financial reporting. Audit fees also include fees for services that are normally provided by Deloitte in connection with statutory and regulatory filings or engagements.
(2) Audit-related fees consist of fees for assurance and related services by Deloitte that are reasonably related to the performance of the audit or review of our financial statements and are not reported under audit fees. This category includes fees related to audit and attest services not required by statute or regulations, consultations concerning financial accounting and reporting standards, and other services related to registration statements and public offerings.
(3) All other fees include fees for services rendered by Deloitte that are not included in any other category.
Our audit committee’s policy is to pre-approve all audit and non-audit services provided by our independent registered public accounting firm. Pursuant to this policy, our audit committee pre-approved all of the services described in the footnotes to the table above.
34
PART IV
Item 15. Exhibits, Financial Statement Schedules
Notwithstanding any language to the contrary, Exhibits 101 and 104 shall not be deemed to be filed as part of this annual report for purposes of Section 18 of the Securities Exchange Act of 1934.
|
| Incorporated by Reference | |||||||||
Exhibit | Exhibit Description | Filing |
| Exhibit |
| Filing |
| Filed | |||
24.1 | X | ||||||||||
31.1 | Certification of Principal Executive Officer, pursuant to Rule 13a-14(a) | X | |||||||||
31.2 | Certification of Principal Financial Officer, pursuant to Rule 13a-14(a) | X | |||||||||
101 | Interactive Data Files | X | |||||||||
104 | Cover page interactive data file, submitted using inline XBRL (contained in Exhibit 101) | X |
35
SIGNATURES
Pursuant to the requirements of Section 13 or 15(d) of the Securities Exchange Act of 1934, the registrant has duly caused this report to be signed on its behalf by the undersigned, thereunto duly authorized.
| Redfin Corporation | ||||
(Registrant) | |||||
April 25, 2025 | By | /s/ Glenn Kelman | |||
(Date) | Glenn Kelman Chief Executive Officer |
Pursuant to the requirements of the Securities Exchange Act of 1934, this report has been signed below by the following persons on behalf of the registrant and in the capacities and on the dates indicated:
Name |
| Title |
| Date |
/s/ Glenn Kelman | Chief Executive Officer and Director | April 25, 2025 | ||
Glenn Kelman | ||||
/s/ Chris Nielsen | Chief Financial Officer (Principal Financial | April 25, 2025 | ||
Chris Nielsen | ||||
* | Chairman of the Board of Directors | April 25, 2025 | ||
David Lissy | ||||
* | Director | April 25, 2025 | ||
Robert Bass | ||||
* | Director | April 25, 2025 | ||
Julie Bornstein | ||||
* | Director | April 25, 2025 | ||
Kerry Chandler | ||||
* | Director | April 25, 2025 | ||
Austin Ligon | ||||
* | Director | April 25, 2025 | ||
Brad Singer | ||||
* | Director | April 25, 2025 | ||
James Slavet | ||||
* | Director | April 25, 2025 | ||
Selina Tobaccowala |
* | The undersigned, by signing his name hereto, does hereby sign this Amendment No. 1 to Form 10-K/A on behalf of the above indicated officer or director of the registrant, Redfin Corporation, pursuant to the Power of Attorney signed by such officer or director on February 27, 2025, in the Original Form 10-K. |
By | /s/ Glenn Kelman | |
Glenn Kelman | ||
Chief Executive Officer |
36